THM Dynamic Analysis: Debugging
Task 1 - Introduction
In Basic Dynamic Analysis room, we have learnt how to identify malware traces in an infected system during execution. However, malware authors understand that malwares are analyzed and want to thwart this by doing some more advanced evasion techniques.
In order to defeat some of them, we will learn how a malware analyst can control malware execution to achieve the desired results.
Learning Ojectives
- Evasion techniques used to evade basic dynamic analysis
- Introduction to debuggers and how they can help us control the execution flow of malware
- Manipulating execution flow at runtime by changing registers or other parameters
- Patching malware to force it to move past the evasion techniques onto the actual malicious content
Pre-requisites
It is recommended to have followed these rooms to get a better understanding from this one:
Task 2 - The Need for Advanced Dynamic Analysis
Analyzing malware is like a cat-and-mouse game. While malware analysts keep devising new techniques to analyze malware, malware authors conceives new techniques to evade detection.
Evasion of Static Analysis
In static analysis, because we are not executing the malware, its main focus for evading is to obfuscate the true functionality of the program until it is executed. The following techniques are the common ones used to achieve this:
- Changing the hash: Since every file has a unique hash, sligthly changing the malware bypasses a hash-based detection mechanism (unless we are talking about fuzzy hashes). This is usually done by adding a
NOPinstruction. - Defeating AV signatures: Signature-based detection often depend on static patterns found inside the malware. Signature detection is evaded by changing those and adding some obfuscation.
- Obfuscation of strings: Strings can be obfuscated in the code and decoded at runtime. This makes string search unsuccessful. Malware authors might obfuscate important strings such as URLs, C2 domains, etc…
- Runtime loading of DLLs: When analyzing a malware statically, we might not see all the functions it is linked to because they are loaded at runtime using
LoadLibrary. However, we can try to identify what imports are being made. - Packing and Obfuscation: Packing is a very popular way to obfuscate a binary owing the fact that a packer packs the malware in a wrapper by encoding the actual code and writing code that decodes it at execution.
Evasion of Basic Dynamic Analysis
Since malware won’t let themselves being detected, a host of techniques are employed, of which the most common ones are identifying if the malware runs in a controlled analysis environment. The following techniques are used for this purpose:
- Identification of VMs: Though some of these techniques might backfire nowadays since a lot of company infrastructures are hosted on VM, one of the favourites is to identify if the malware is running inside a VM. For this, registry keys or drivers associated with popular virtualization software like VirtualBox/VMWare are checked. Similarly, minimal ressources such as a single CPU and limited RAM might indicate that the malware is running inside a VM. In this case, malware will take a legitimate execution path to fool the analyst.
- Timing attacks: To time out automated analysis systems, the Windows Sleep Library is mainly used. These type of systems usually shut down after a few minutes, finding no traces of malicious activity. Newer analysis systems can identify these attacks and try to mitigate them by shortening the time the malware sleeps. However, those mitigations can be identified by the malware by noting the time of execution and comparing with the current time after the execution of the sleep call.
- Traces of user activity: Malware tries to identify traces of user activity (mouse, keyboard, browser history, recently opened files, little system uptime…), then if no or few traces are found, it will change its execution scheme.
- Identification of analysis tools: Running processes can be listed on Windows systems using
Process32First,Process32Next, etc… If popular monitoring tools are identified among the list like ProcMon or ProcExp, the malware can switch its activites. Another ways of identifying are by looking at the names of different windows, searching for some services or checking applications behaviour.
Questions
Malware sometimes checks the time before and afte r the execution of certain instructions to find out if it is being analysed. What type of analysis technique is bypassed by this attack?
Answer: Basic Dynamic Analysis
What is a popular technique used by malware authors to obfuscate malware code from static analysis and unwrap it at runtime?
Answer: Packing
Task 3 - Introduction to Debugging
The term Debugging is widely used by software programmer to identify and fix bugs in a program. Similarly, a malware trying to evade detection or reverse engineering can also be considered as a program having a bug.
Because a malware analyst often has to debug a program to remove any roadblocks that prevent it from performing its malicious activity, interactive debugging becomes an essential part of Advanced Malware Analysis. Debugger provides the control to running a program more closely by looking at the changes in different registers, variables and memory regions step by step as each instruction is executed one at a time. It also provides the ability to change the variables’ values and other parameters to control the program’s flow at runtime.
Source-Level Debuggers
Source Level Debuggers work on the source code of a program and are often used by software developpers to check bugs in their code. It is a high-level option compared to the two other ones.
Assembly-Level Debuggers
When a program has been compiled, its source code is lost and can’t be recovered. Usually, we don’t have the malware’s source code we are investigating and have a compiled binary instead. An assembly-level debugger can help us debug compiled programs by seeing the CPU regsiters’ values and the debugger’s memory. This is the most common type of debugger used for malware RE.
Kernel-Level Debuggers
This type of debugger is a step even lower than assembly-level ones. As the name suggests, it permits the debug of a program at the Kernel Level which involves two systems, one used for debugging and another one where the code is running. This is because if the kernel is stopped using a breakpoint, the whole system will stop.
Questions
Can we recover the pre-compilation code of a compiled binary for debugging purposes? Write Y for Yes or N for No
Answer: N
Which type of debugger is used for debugging compiled binaries?
Answer: Assembly-level debugger
Which debugger works at the lowest level among the discussed debuggers?
Answer: Kernel-level debugger
Task 4 - Familiarization with a Debugger
For malware analysis, there are many options to choose a debugger from, such as Windbg, Ollydbg, IDA, Ghidra and x32/x64dbg. Here, we will be using the last one.
When we open x32dbg (x32dbg for 32-bit applications, x64dbg for 64-bit applications) in FLARE VM Desktop > Tools > debuggers > x32dbg.exe, we are greeted with this interface:
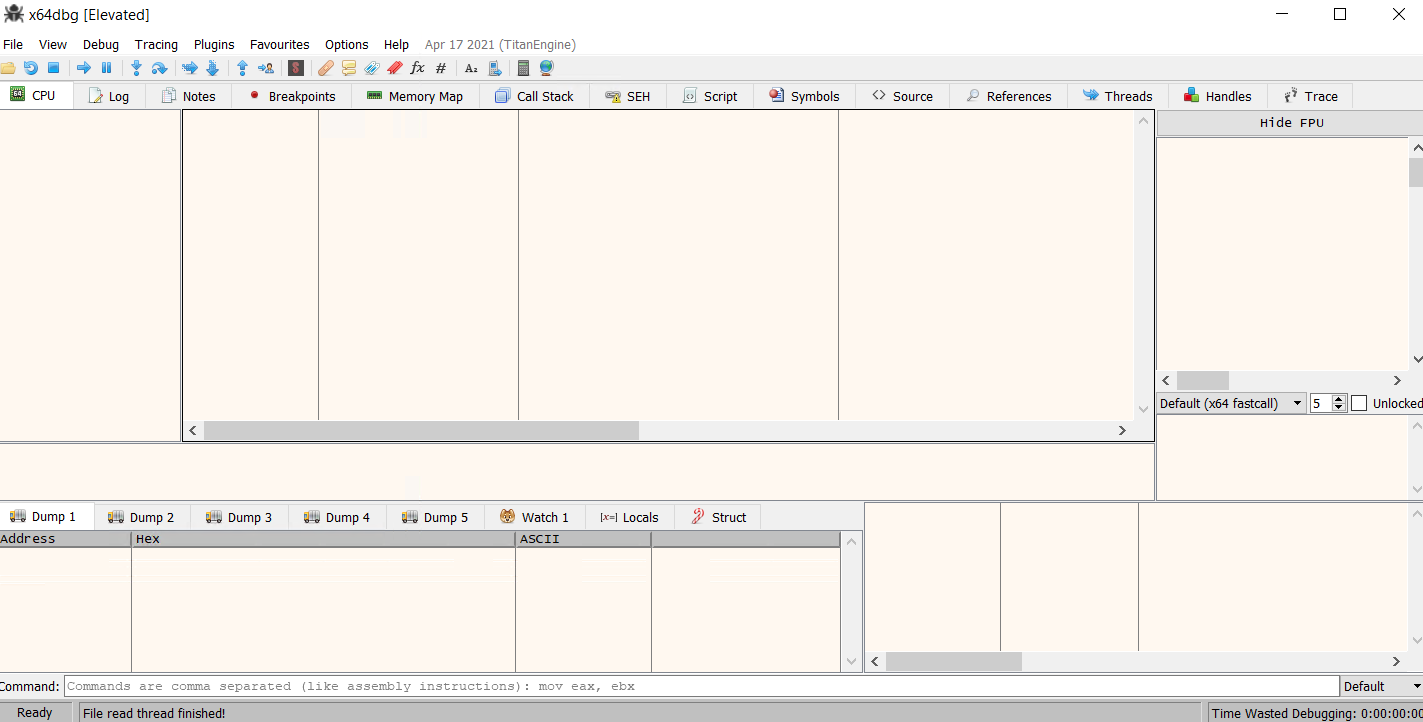
To open a file in the debugger, we can navigate to File > Open. The below creenshot show the interface with a sample opened in the debugger.
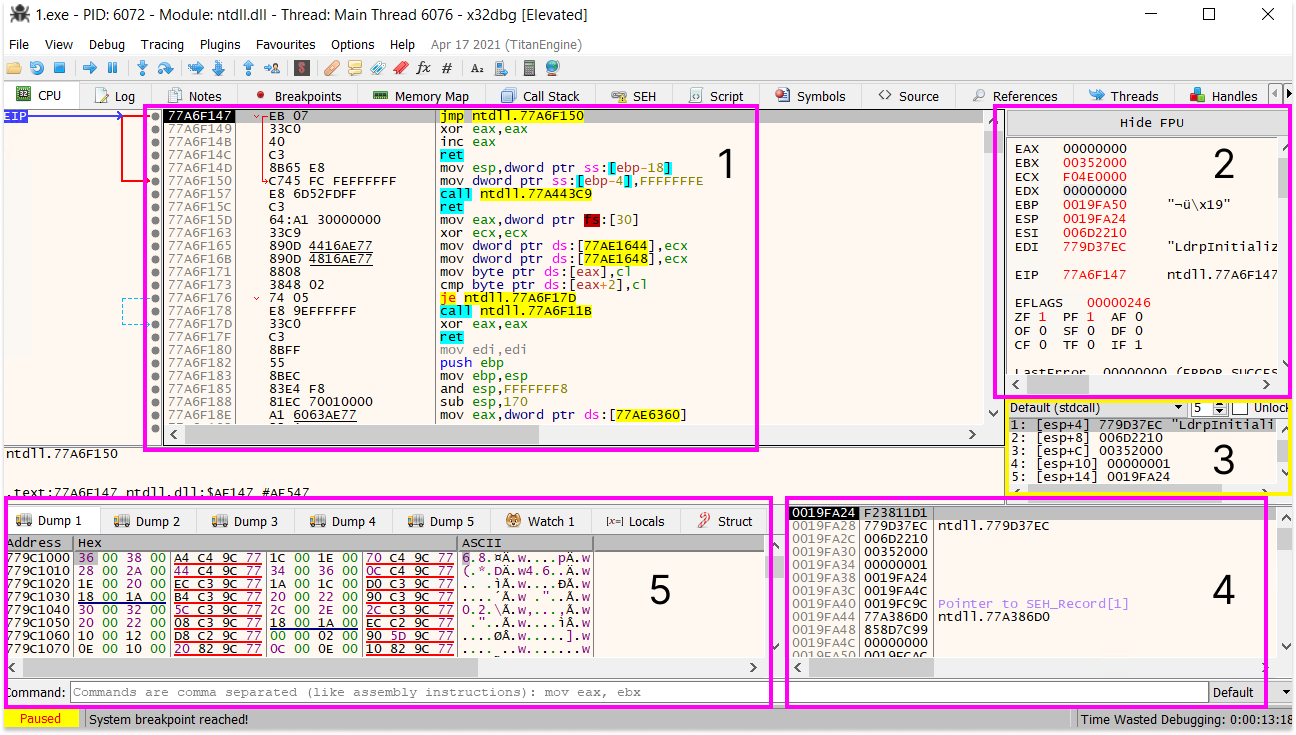
As we can see in the bottom-left corner, the execution of the program is paused because a System breakpoint has been reached. We can control whether to execute one instruction at a time or the whole program.
In the screenshot above, we can see different parts in the main window, where each one have a specific role:
- CPU disassembly: This is where the assembly instructions are located.
- In the first colum contains the EIP (Extended Instruction Pointer) pointing to the next instruction which will be run.
- The second column contains addresses within the binary where instructions reside, here EIP is pointing to
77A6F147. - The third colum is the hexadecimal representation of the instruction in column 4.
- The fourth column is where the assembly instructions are located, here the next instruction to be executed is
jmp ntdll.Memoryaddress. - The fifth column is contains data populated by x64dbg or notes that have been added by the analyst. Most of the time, binary’s strings will be shown here.
- CPU Registers: This window contains information related to registers and flags. More information available in x86 Architecture Overview
- EAX: Used for addition, multiplication and return values
- EBX: Generic register, used for various operations
- ECX: Used as a counter
- EDX: Generic register, used for various operations
- EBP: Used to reference arguments and local variables
- ESP: Points to the last argument on the stack
- ESI/EDI: Used in memory transfer instructions
- EIP: Points to the current instruction in x32dbg that will be executed
- FLAGS
- Stack Memory: This window contains the parameters that have been pushed onto the stack.
- Stack and data: This window contains the stack, the data that has been pushed onto the stack and the addresses in memory they are mapped to.
- Dump Data: This window allows the user to see what is being stored in a register or what data resides at a certain address.
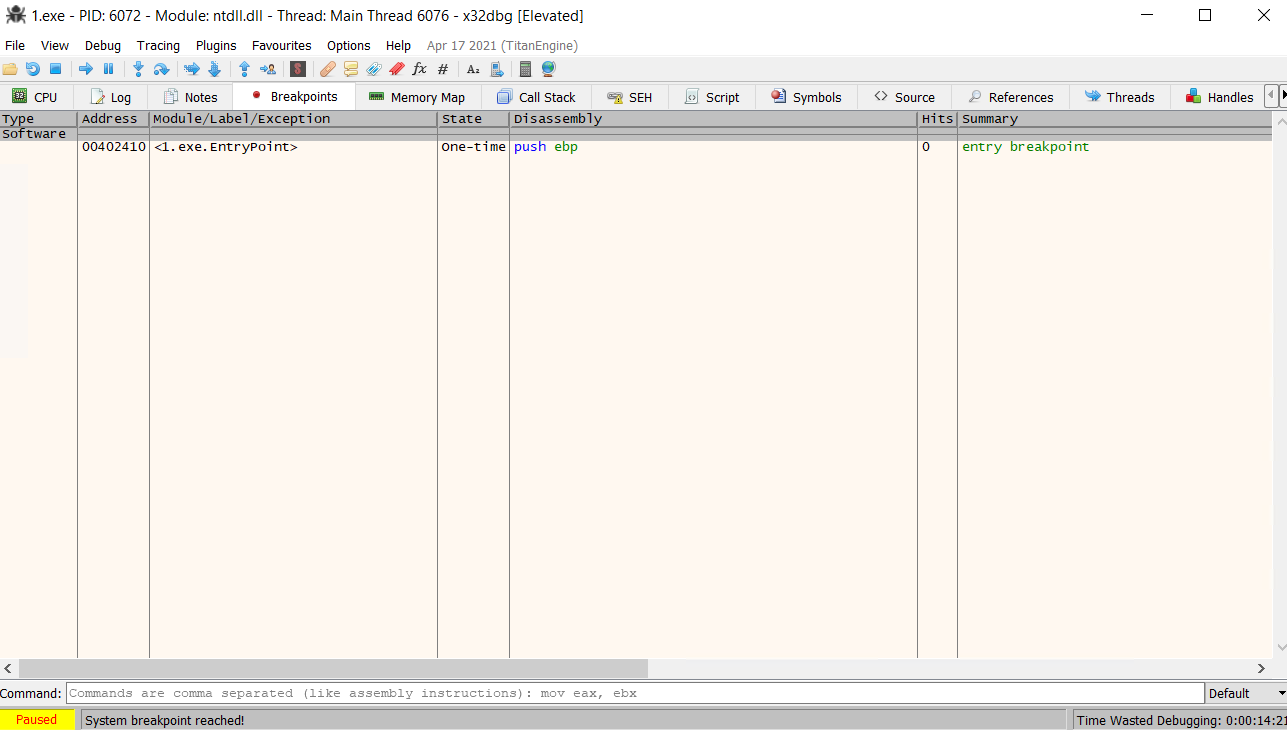
Let’s look at some of the other tabs. The breakpoints tab shows the current status of breakpoints. Breakpoints are where the execution of the program is paused for the analyst to analyze the registers and memory. It can be enabled by clicking the dot located in front of each instruction in CPU tab.
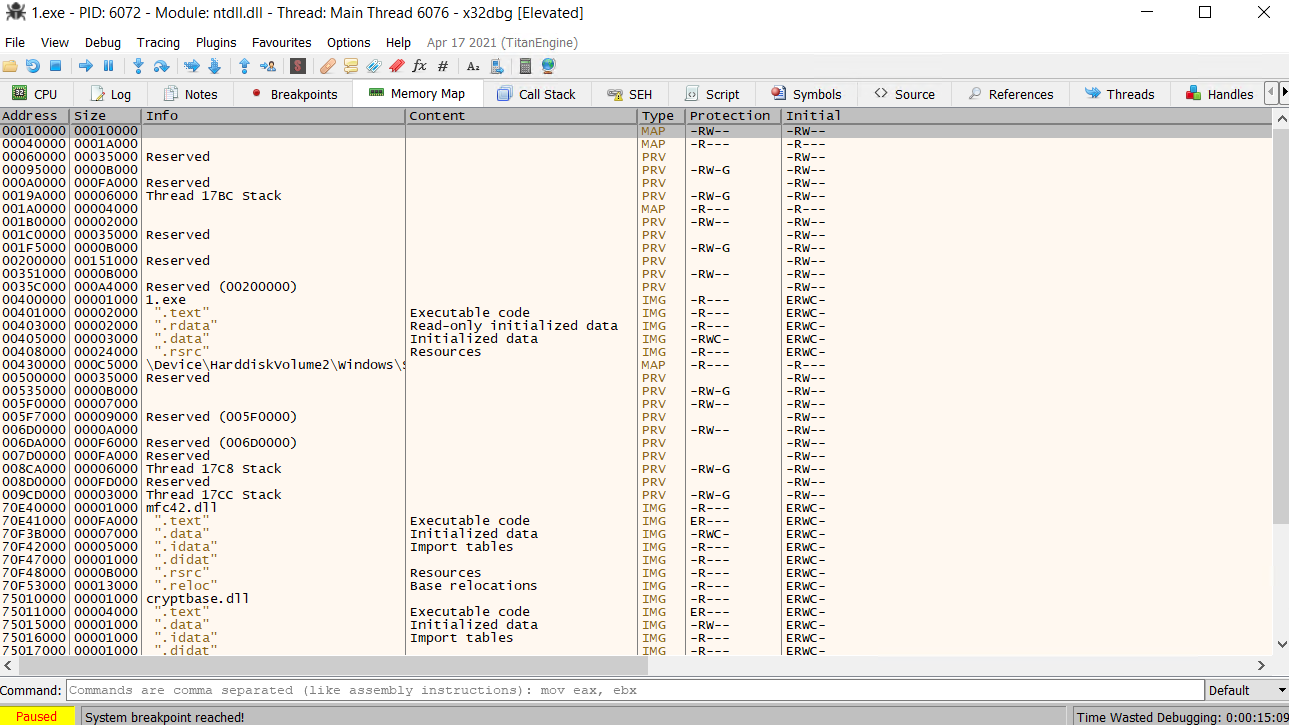
The Memory Map tab show the memory of the program:
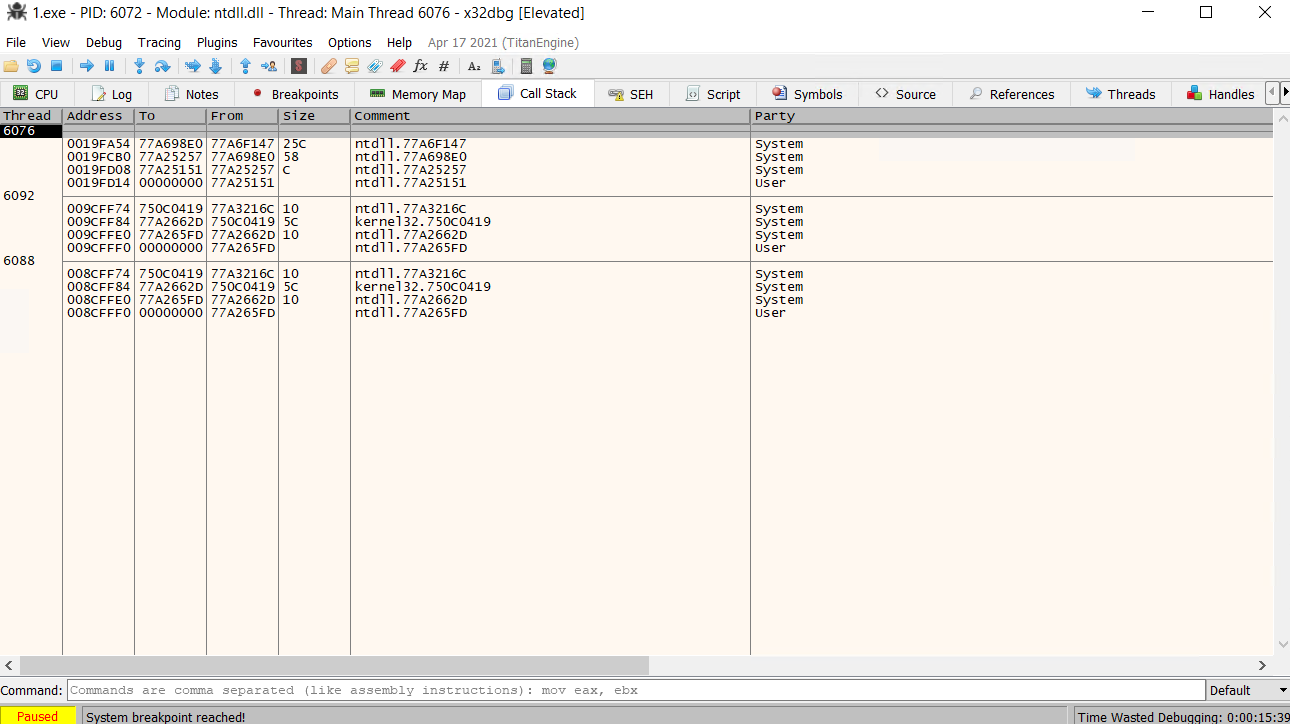
We can also see the Call Stack of the program:
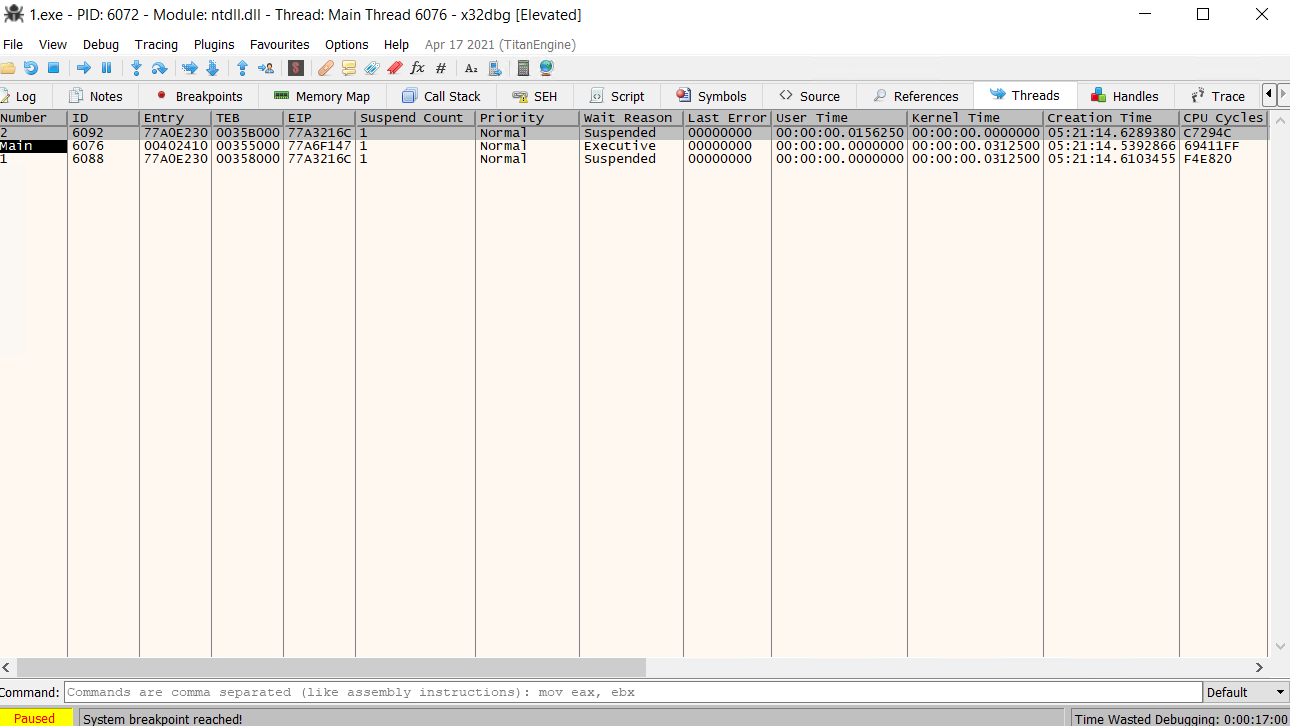
Running threads of the current program are show in the Threads tab:
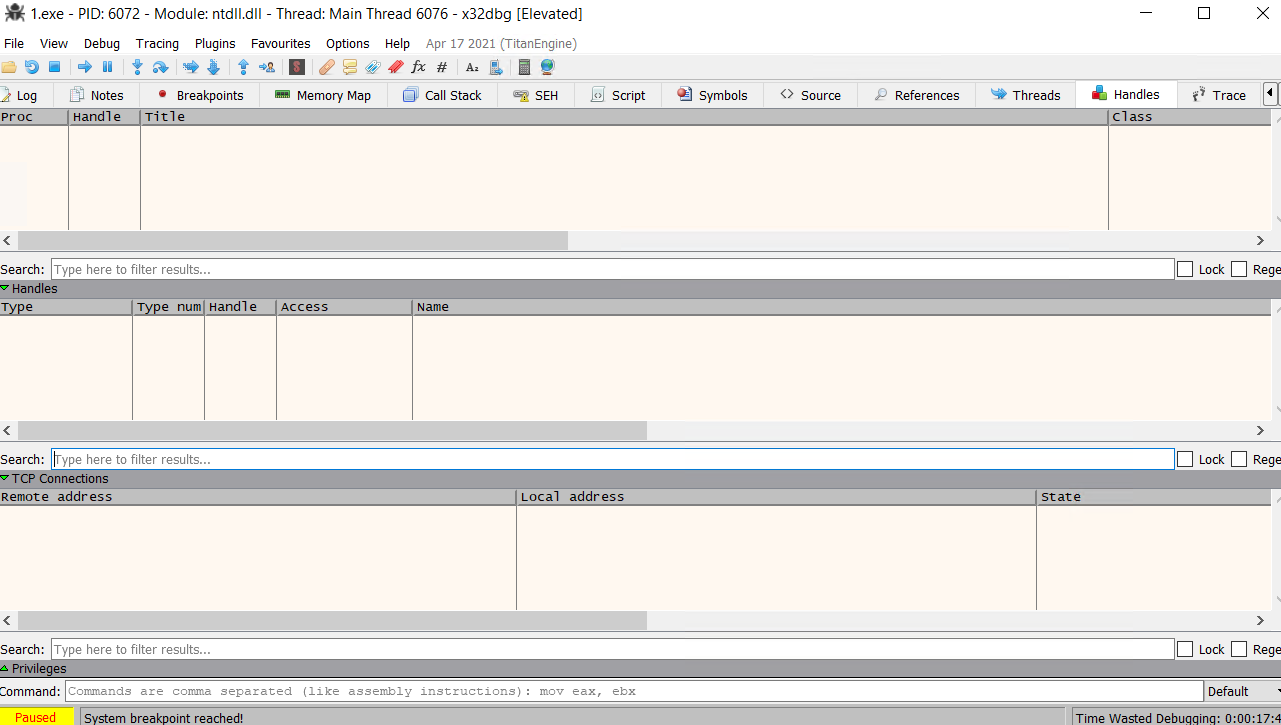
Any handles to files, process or other ressources the process accesses are shown in the Handles tab:
Questions
In which tab is the disassembly view shown in x32dbg?
Answer: CPU Tab
If a process opens a file or a process, where can we see information regarding that opened file or process?
*Answer: Handles Tab
Task 5 - Debugging in Practice
Now we are bit more familiar with the UI of x32dbg, let’s learn about debugging a program in practice by executing it step-by-step.
Firstly, we select the file we need to open using File > Open or with F3. The debugger attaches itself to the process and pauses it before it starts, that is why we see a blank command window in the background. Furthermore, the window might not open with all processes depending on the UI (User Interface) of the process.
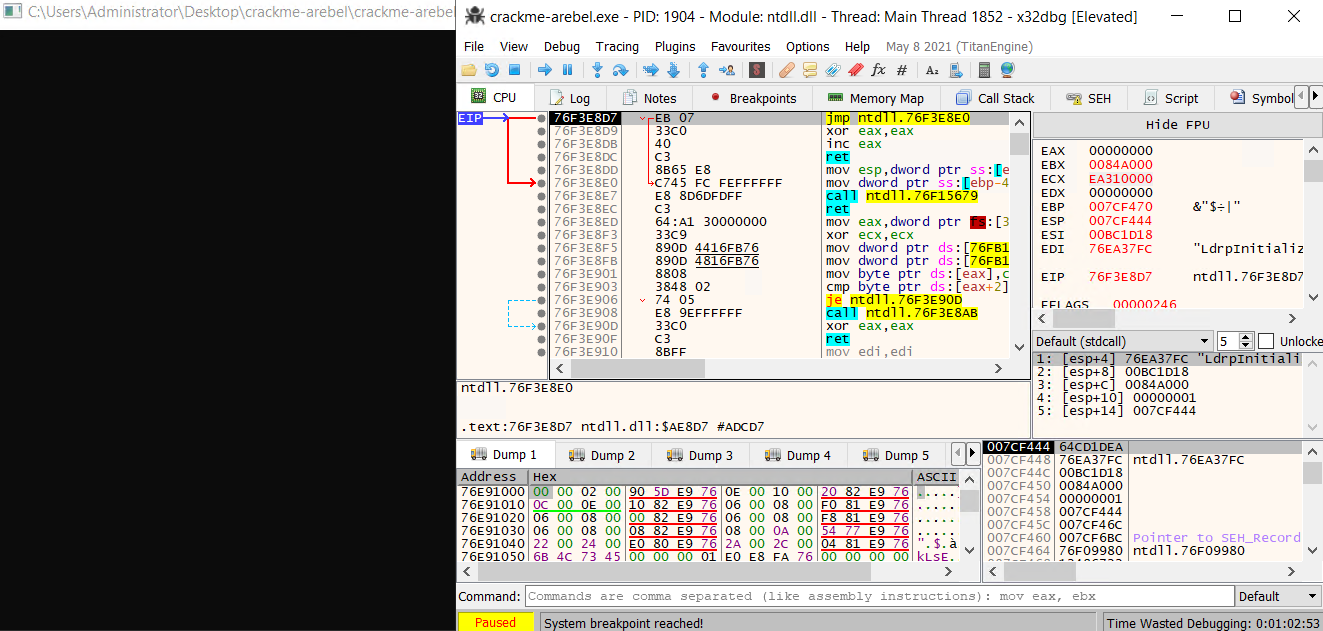
In the debugger window, we have some features that help us control the execution, presented in the screenshot below:
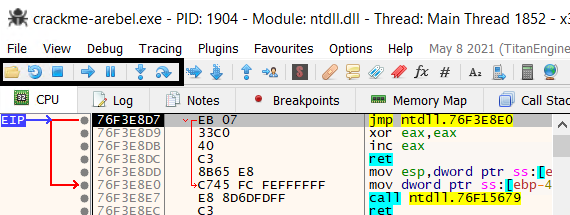
Among these buttons, from left to right we have the feature for:
- Opening a new file
- Restarting the execution of the app from the start
- Stopping the execution
- Execute the program until it is stopped or paused by some control/breakpoint
- Pause the execution
- Step into a function call
- Step over a function call
To start with debugging, we use the arrow button to go the first breakpoint, which is normally the entry point of the program. Along with the status, we see the reason INT3 breakpoint “TLS Callback 1”, which means we have hit a TLS Callback and the debugger is configured to automatically break on them.
To resume, a Thread Local Storage or TLS for short, is a mechanism which allows a thread to have its own storage for data with its own instance of variables in order to not make interference in multithread application. TLS Callbacks are special functions in Windows used to initialize or clean process or thread data.
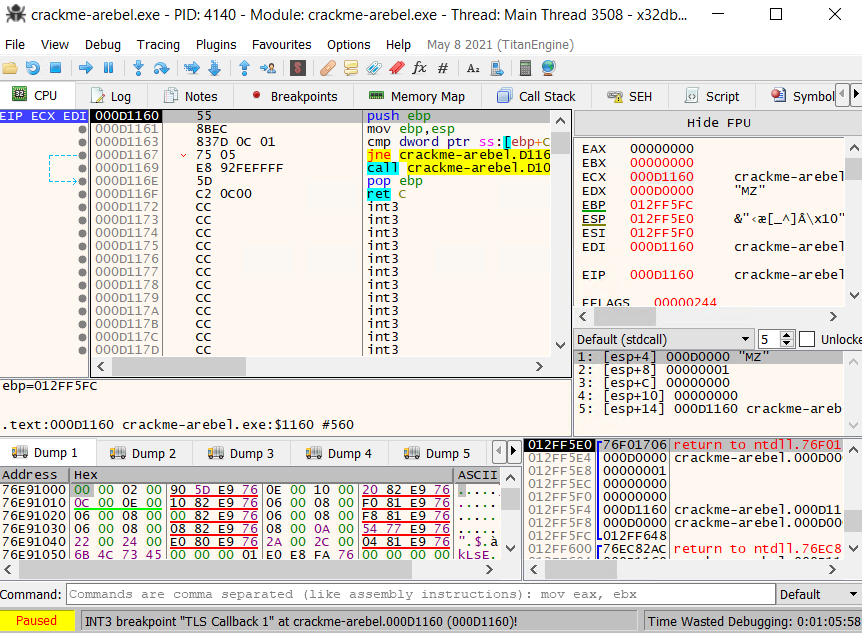
In the debugger, we can set where to put automatic breakpoints in Options > Preferences menu. Here, we can see that TLS Callbacks breakpoints are checked.

Since TLS Callbacks are often used as an anti-reverse engineering technique because they are running before the entry point of the program. Therefore, we should be careful when navigating with TLS Callbacks and single-step each instruction while we are in the callback. After stepping into every instruction, we see the EIP increasing, values in registers and stack change accordingly. Then, we reach a conditional jump instruction jne for jump not equal which jumps if the zero flag ZF is set to 0. In the pane below, the debugger tells us that the jump is not taken.
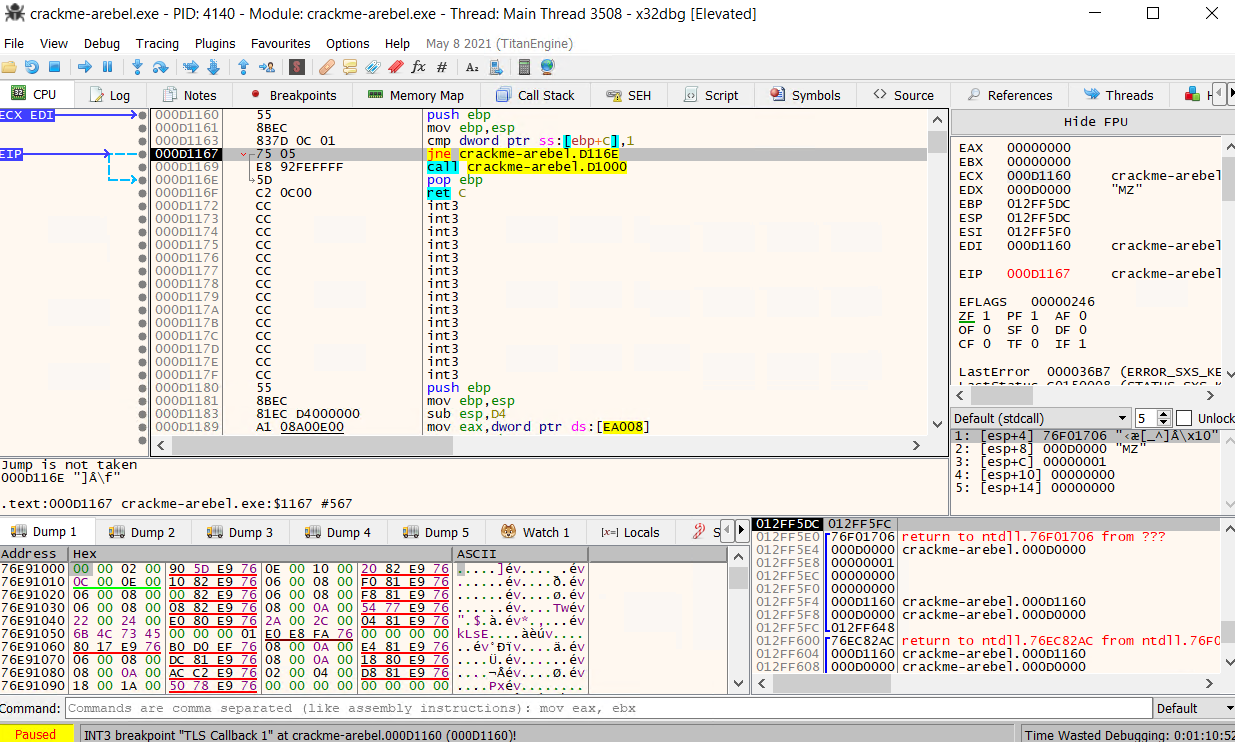
If we analyze both paths, it goes to address D116E if the jump is taken which pops ebp and returns. On the other hand, the current execution path takes us to the address D1000. To know what instruction and execution flow is comming at this address, we can hover it get a glimpse or double clicking to access it.
The below screenshot show the code following at this address and we see a few API calls like CreateToolhelp32Snapshot, LoadLibrary and GetProcAddress further down. If we were sure what this function call was intended for, we could just step over it to bring us back after the execution has been executed.
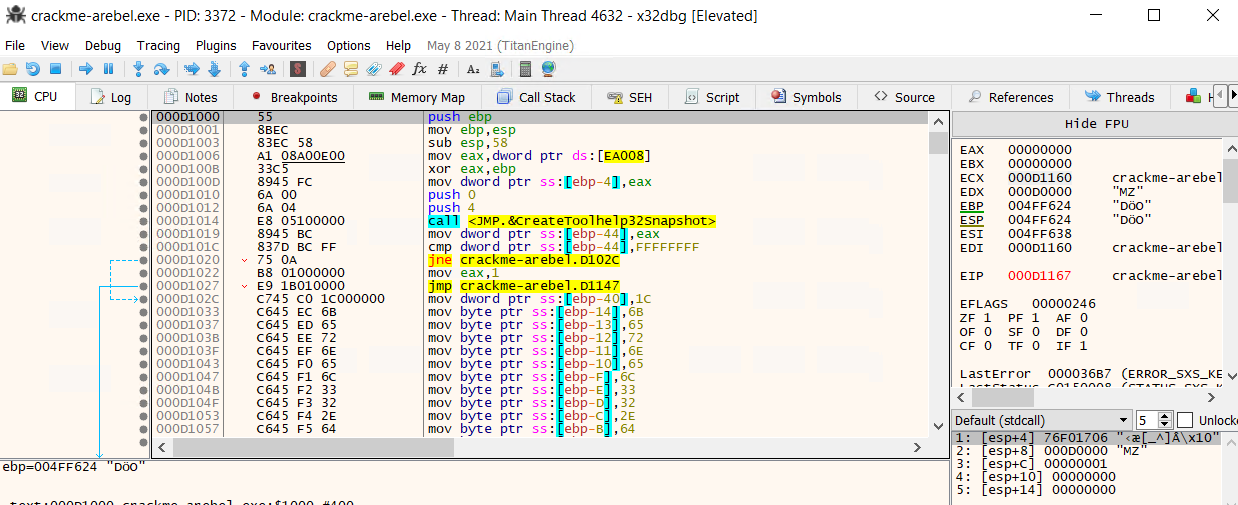
However, the function seem very important and we don’t know if it is used for legitimate purposes or to evade detection. Hence, we must move along this path and restart if we see a red flag. Moving forward, another library loaded is SuspendThread.
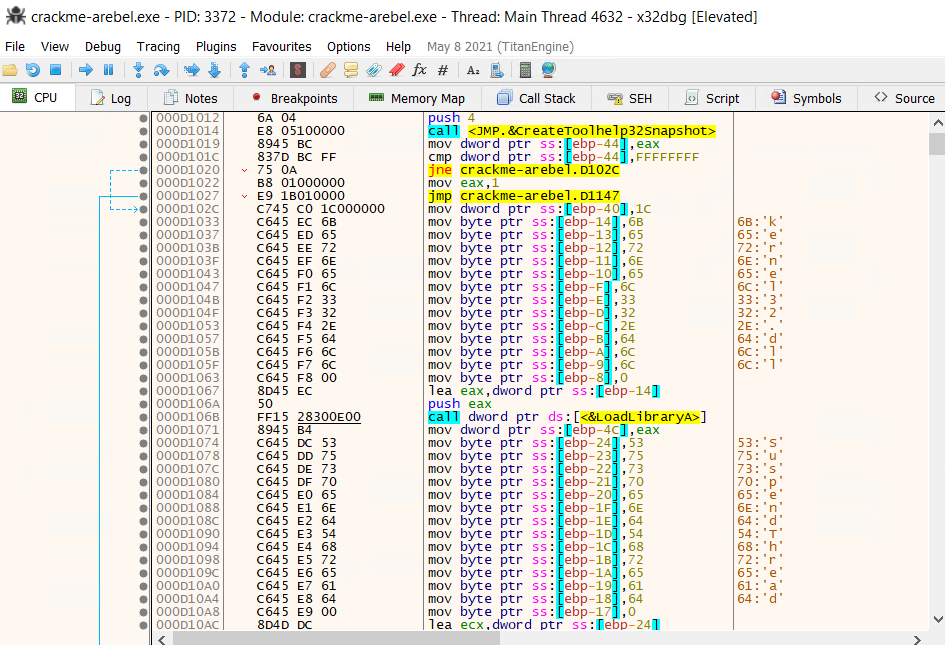
This TLS callback will suspend the thread based on detecting a running process such as a debugger (CreateToolhelp32Snapshot API helps identiéfying processes). This is why the program freeze if we proceed with the execution, thus this will be the goal in the next task to jump over the call.
Questions
The attached VM has a crackme in the directory Desktop > crackme-arebel. In that crackme, there is a TLS callback with a conditional jump. Is this conditional jump taken? Write Y for Yes or N for No
Because ZF = 1, the jne conditional jump is not taken.

Answer: N
What is the value of the Zero Flag in the above-mentioned conditional jump?
Answer: 1
Which API call in the mentioned sample is used for enumerating running processes?
The API call used for enumerating process is at address 000D1014 .
Answer: CreateToolhelp32Snapshot
From which Windows DLL is the API SuspendThread being called?
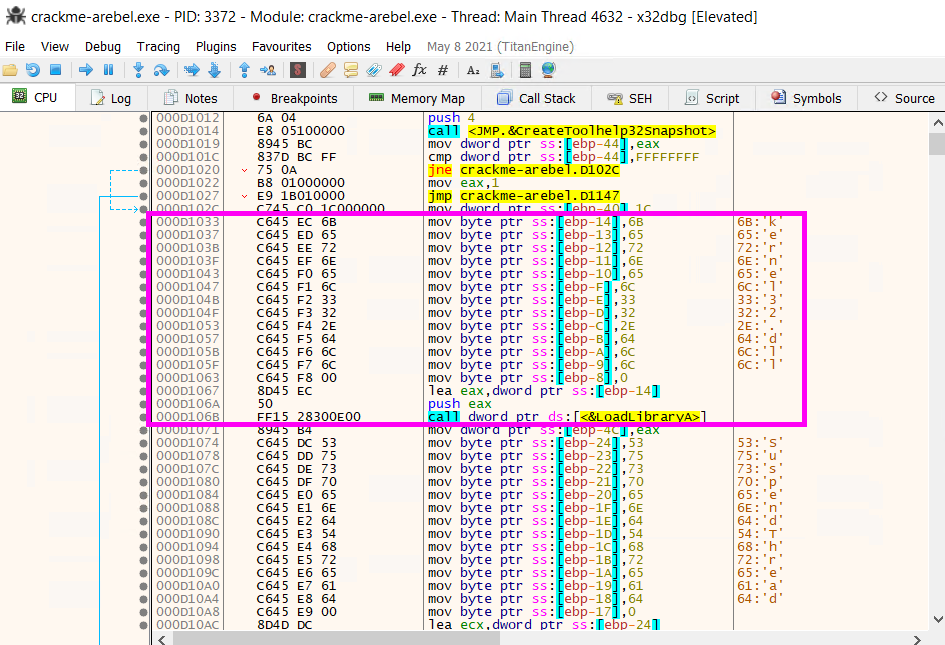
The API SuspendThread documentation is available here. Also, we see that kernel32.dll is being loaded from 000D1033 to 000D106B using LoadLibrary.
Answer: kernel32.dll
Task 6 - Bypassing unwanted execution path
When we reload the crackme and run it one time, we come across the TLS callback again.
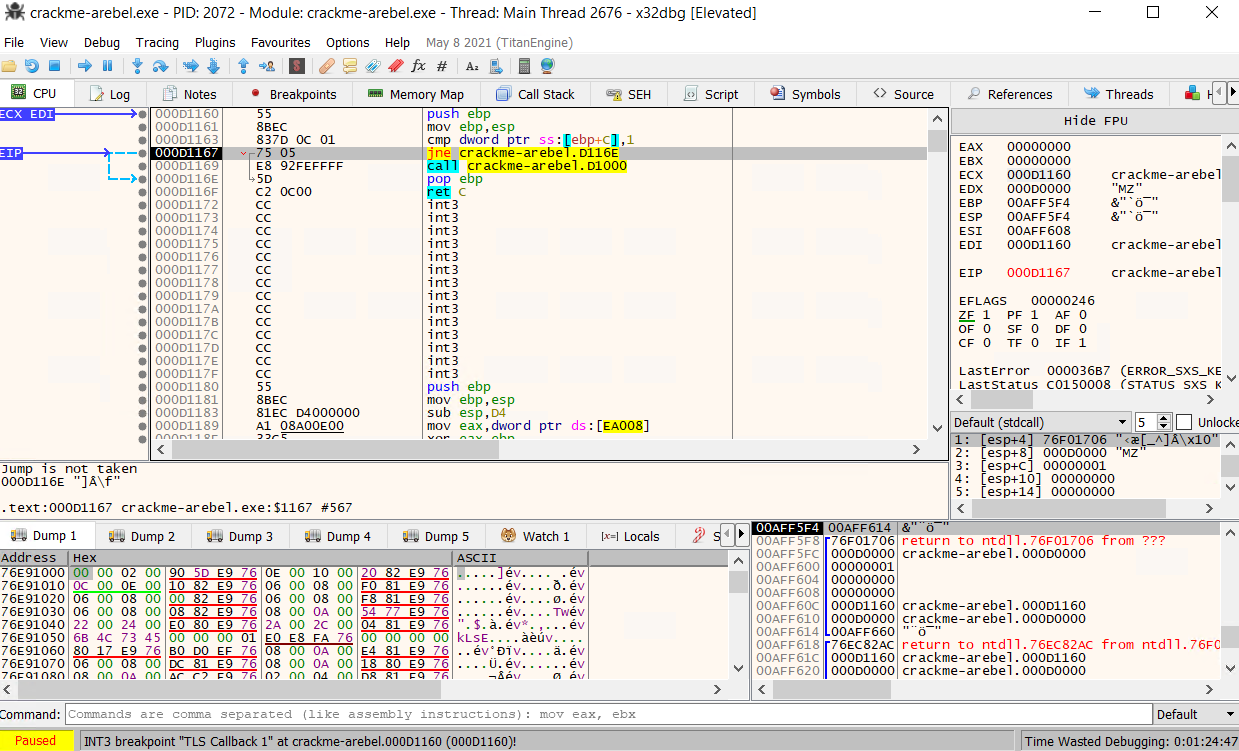
In order to make a jne/jnz jump, we need to set the zero flag ZF to 0. Because the two previous values compared were the same, the ZF was set to 1.

This manipulation with the debugger will make us pass the TLS Callback and make us jump over the evasion detection. This is very practical to use, especially for first time analysis.
Due to the nature of changing a value, restarting our program would make the ZF flag return to value 1. This is time to use patching, which will change the instructions of the program directly into the file.
In our situation, we have multiple choices to bypass this:
- Change
jneinstruction for ajeone - Use a unconditionnal jump
- Fill instructions with NOPs (No operation instruction)
- and more …
Here we will change jne to je. To edit that instruction, we right-click on it, then use Assemble or just use Space on that instruction:
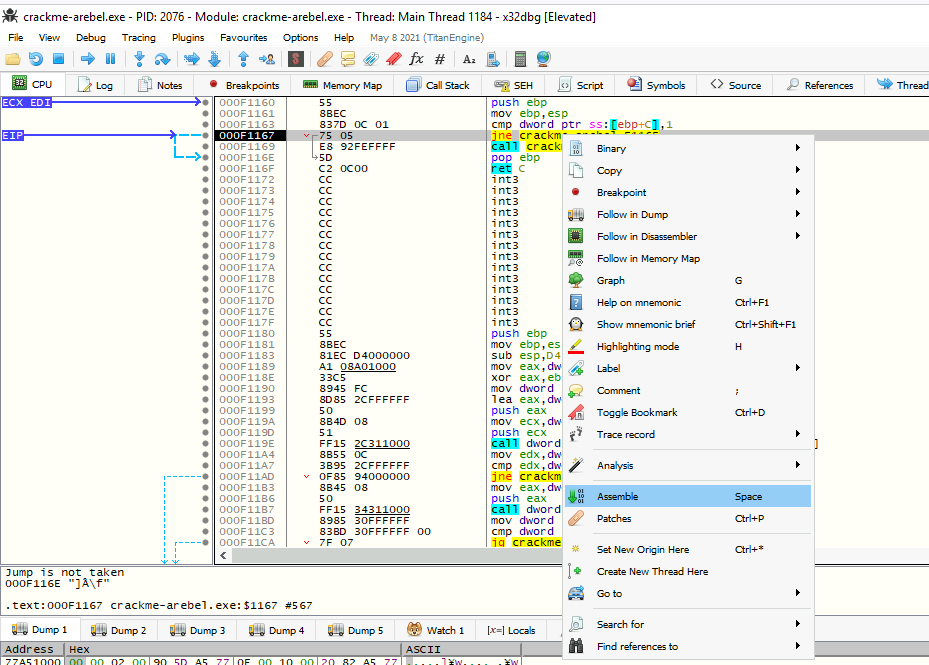
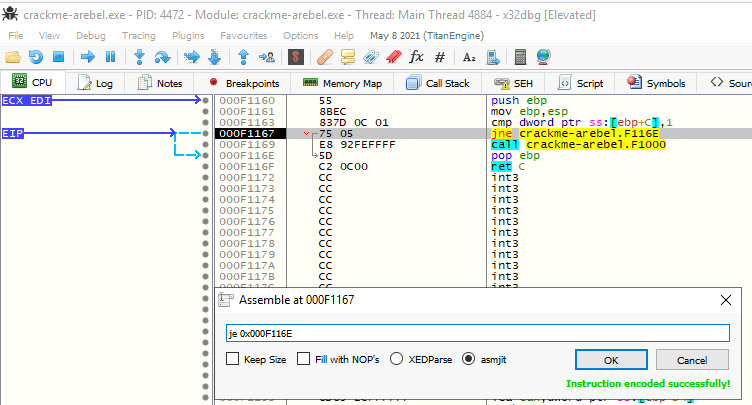
By changing this parameter, we have successfully bypassed this TLS callback:

For the Fill with NOPs option, we use the suggested option by x86dbg by going to Binary > Fill with NOPs it:
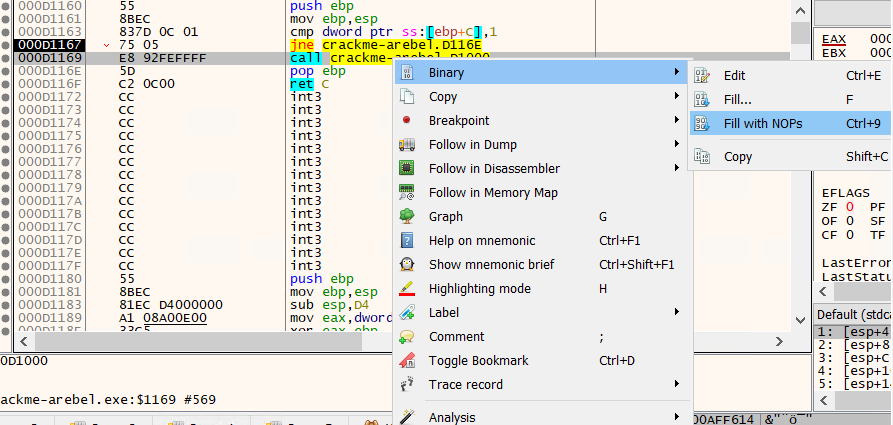
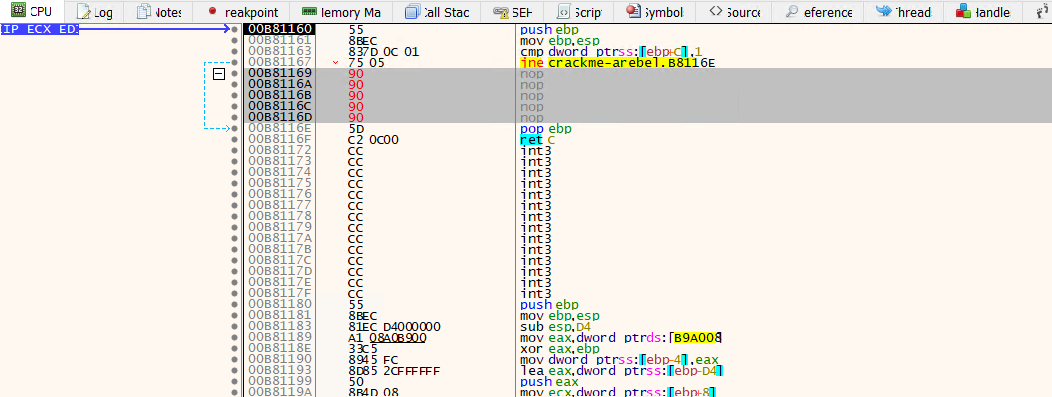
Below is what we get by filling with NOPs. There is 5 nop instructions because we need to have the same instruction size as before the patch in order to preserve the statically contained memory addresses.
The issue with patching a binary is that we need to save it on disk. To patch and export definitely the binary, we go to File > Patch or Ctrl + P:
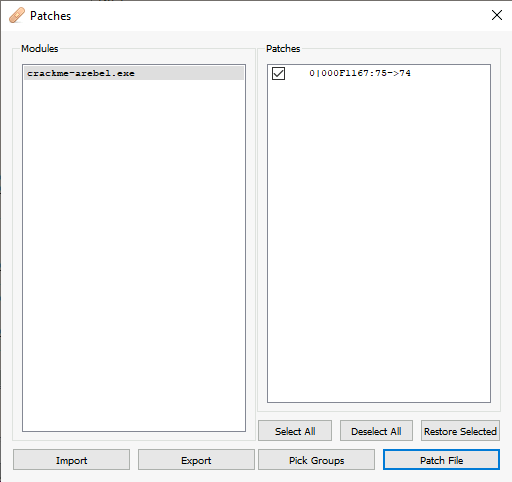
Now, when we go to our patched binary at the same address, we always get the je instruction even if we reload the program:

Question
What is it called when a binary’s assembly code is permanently altered to get the desired execution path?
Answer: Patching
Task 7 - Conclusion
That was it for this room. In this room, we learned the following:
- Common techniques to evade static and basic dynamic malware analysis.
- The use of debuggers for deeper analysis of malware.
- Using debuggers for changing the environment at runtime.
- Using debuggers to patch malware samples.
However, this is not covering all the techniques available. Malware authors also use many techniques to evade dynamic analysis and debugging.
References
https://www.varonis.com/blog/how-to-use-x64dbg https://tryhackme.com/r/room/advanceddynamicanalysis
Enjoy Reading This Article?
Here are some more articles you might like to read next: