THM Basic Dynamic Analysis
Task 1 - Introduction
Previously, we learned techniques to analyze malware without executing it in the Basic Static Analysis room. As we have seen, malwares can use techniques to hide its features from a malware analyst. However, their purpose is to execute, thus traces are left behind when a malware is executed, which can give us some indications about the functions it is using. We will use basic dynamic analysis techniques here to analyze them.
Learning Objectives
In this room, we will learn about:
- Sandboxing and using a sandbox for malware analysis
- The components of a sandbox how to create one ourselves
- Using ProcMon to monitor a process’ activity
- Using API LOgger and API Monitor to identify API calls made by malware
- Using ProcExp to identify if a process is modified maliciously
- Using Regshot to track registry changes made by malware
Pre-requisties
Before starting this room, it is recommended to complete the following room for a better understanding:
Task 2 - Sandboxing
In all the malware anlysis rooms, it has been emphasized that malware sould only be analyzed in a controlled environment, ideally a VM. However, this becomes increasingly important for the dynamic analysis of malware.
So, what is required to create a sandbox ?
- An isolated machine, ideally a Virtual Machine that is not connected to live/production systems and is dedicated to malware analysis
- The ability for the machine to save its initial state and revert to it once the malware analysis is complete like snapshots.
- Monitoring tools that help us analyze the malware whil it is executing. These can be automated as we see in automated sandboxes or manual, requiring the anayst to interact while performing analysis.
- A file-sharing mechanism that is used to introduce the malware into the environment and sends the analysis data/report to us. Often, shared directories or network drives are used but must be unmounted when executing the malware, especially for ransomwares.
Virtualization
A lot of tools are available for virtualization. The main ones are:
- Oracle’s VirtualBox (free)
- VMWare’s Workstation (paid)
VMWare Player is not suited for sandboxing because it can not create snapshots, which is a critical requirement for dynamic analysis.
Apart from these, server-based virtualization software like WenServer, QEmu, ESXi… help with virtualization on a dedicated server. This type of setup is often used by enterprises for their virtualization needs and security reaserch organizations often use similar technologies to create a VM farm for large-scale virtualization.
The VM’s OS needs to be the same as the malware’ target OS for dynamic analysis. In most scenarios, this will be Windows, and we will be covering tools related to Windows in this room.
Analysis Tools
Once we have a VM, we need some analysis tools. It is possible to use packages made for RE like Flare VM or REMnux. Automated malware analysis systems have some built-in tools that analyze malware behaviour, like in Cuckoo sandbox with cuckoomon. When all tools are installed, it is a must to take snapshot. It will ensure we have a clean state that we can revert and ensure our analysis is not contaminated by different malware samples running simultaneously.
File-sharing
Different platforms provide different options for sharing file between host and guest OS. In the most popular tools like VirtualBox or VMWare Workstation, the following options are common:
- Shared folder
- Create an iso and mounting it to the VM
- Clipboard copy and paste
Apart from these, running a web server on the guest where malware samples can be uploaded or mounting a removable drive to the VM is possible. Note that the more isolated the option to share files is, the safer it will be for the host OS. apart for sharing malware, this option is also used to extract analysis reports from the VM.
Question
If an analyst wants to analyze Linux malware, what OS should their sandbox’s Virtual Machine have?
Answer: linux
Task 3 - ProcMon
In this task, we will learn how to use Process Monitor, or ProcMon to analyze malwares’ activities. ProcMon is a part of the Sysinternals suite, a set of utilities that provides advanced funcitonalities for Windows. They are widely used in security research and we will cover some of them in this room.
Once procmon.exe is launched, the following window will apear:
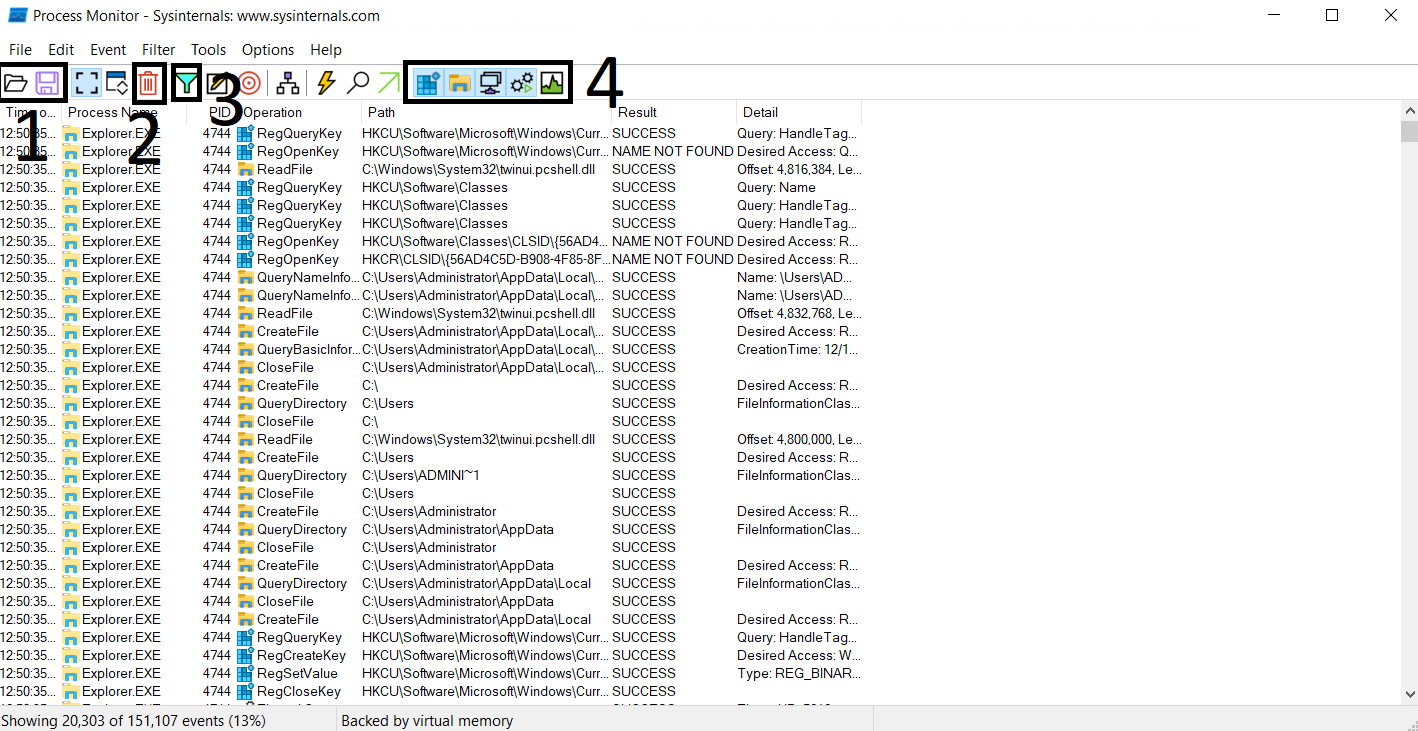
- Shows the Open and Save options. These options are for opening a file that contains ProcMon events or saving the events to a supported file.
- Shows the Clear option to clear all the events currently being shown by ProcMon. It is good to clear the events once we execute a malware sample of interest to reduce noise.
- Shows the Filter option to have further control over the events shown in the window.
- These are the toggle buttons to turn on/off Registry, FileSystem, Network, Process/Thread and Profiling events.
Below these conrtols, we can ee from the left to the right the Time, Process, Process ID (PID), Event Name, Path, Result and Details of the activity. Events are shown in chronological order and ProcMon will show an overwhelming number of events occuring on the system by monitoring every system activity. That is why filtering is important for ease of analysis.
Filtering Events
An easy way of filtering events is to filter from the events window itself.
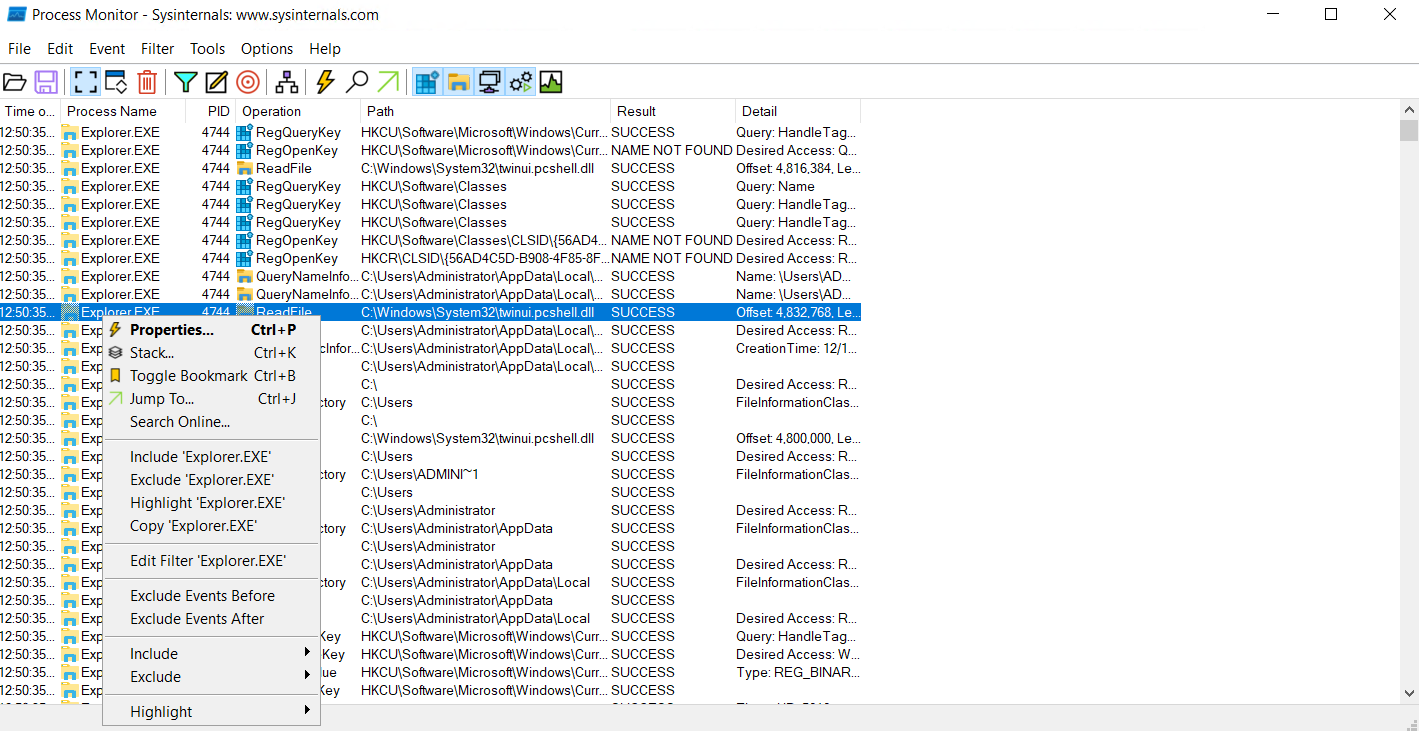
By right clicking on the Process Name column of the process of our choice, a pop-up menu appears and some options are related to filtering. If we choose Include 'Explorer.EXE', ProcMon will only show events with Process Name Explorer.exe. The opposite is available for Exclude Explorer.EXE; it will exclude Explorer.exe from the results.
Similarly, we can filter other options by right-clicking on the corresponding columns (PID, Operation, Path…).
Advanced Filtering
Advanced filters are available on the menu marked as 3 on the above screenshot. When clicking on this, we will se the following pop-up:
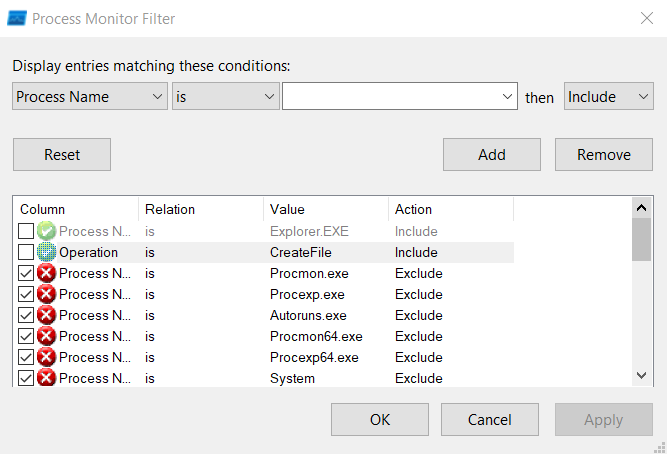
We can see some preset filters are already applied for filtering out some of the tools from the Sysinternals Suite. Furthermore, filtering is quite simple to implement; we select filtering values like Process Name, its relation, value and action. If the checkbox is ticked, the filter is applied, otherwise it is not.
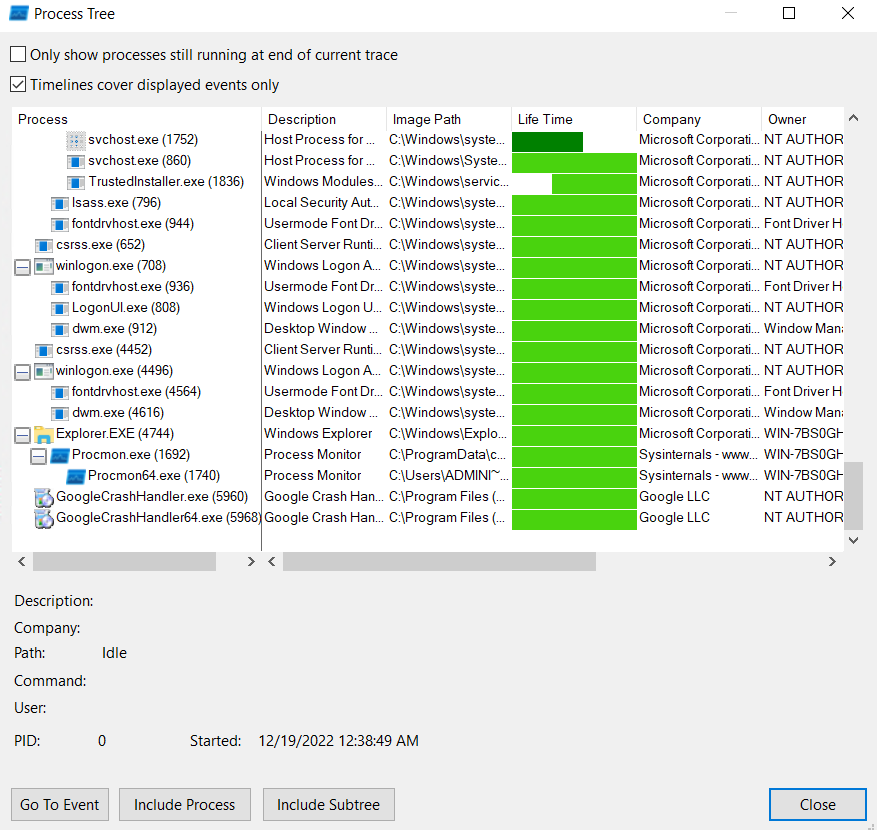
Process Tree

Questions
Monitor the sample ~Desktop\Samples\1.exe using ProcMon. This sample makes a few network connections. What is the first URL on which a network connection is made?
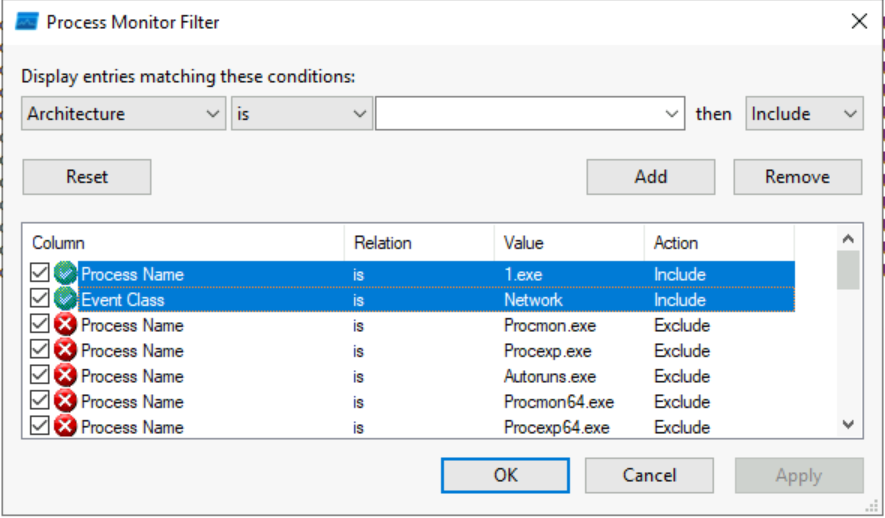
Here, we are using filters for the Process Name and the Event Class to only filter the sample 1.exe and the network connection the malware wants to make.

Answer: 94-73-155-12.cizgi.net.tr:2448
What network operation is performed on the above-mentioned URL?
Answer: TCP Reconnect
What is the name with the complete full path of the first process created by this sample?
Answer: C:\Users\Administrator\Desktop\samples\1.exe
Task 4 - API Logger and API Monitor
The Windows OS abstracts the hardware interaction to the user by providing an Application Programmable Interface (API) for performing all tasks. For example, there is an API to create files, another to create process, and so on. Therefore, one way to identify malware behaviour is to monitor which API calls a malware do. While API’s names are generally self-exlpanatory, MSDN Documentation can be referred for finding more information.
In this task, we will learn more about API logger and API monitor which can help us identify what API calls malware is making.
API Logger
API Logger is a simple tool that provides basic information about APIs called by a process. The main window is depicted below:
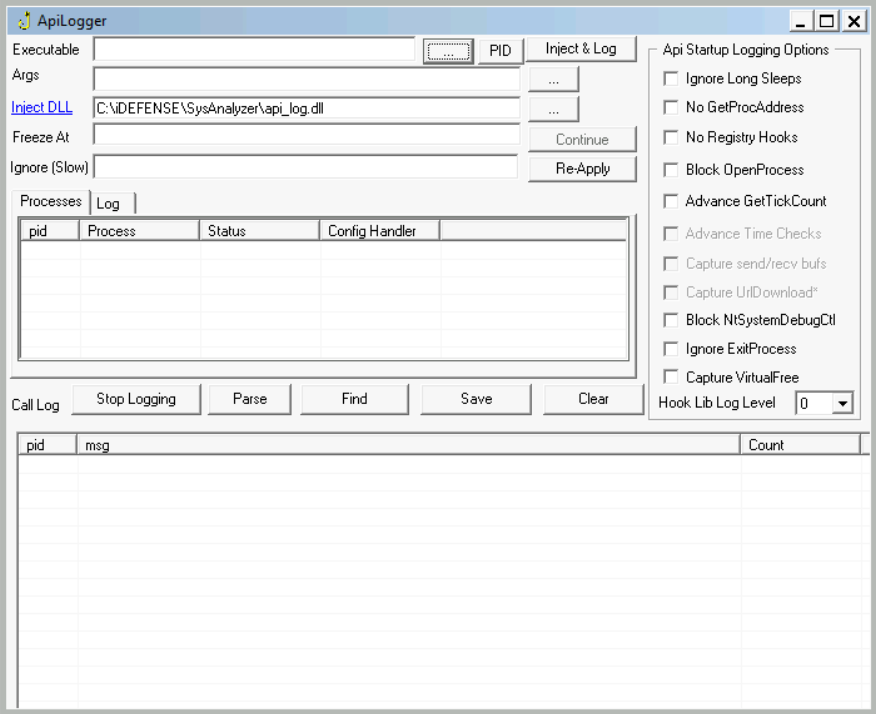
To open a new process, we can provide the path of the executable or search for it using the three-dot menu.
Moreover, an existing process can be monitored by providing its PID. The following window will appear:
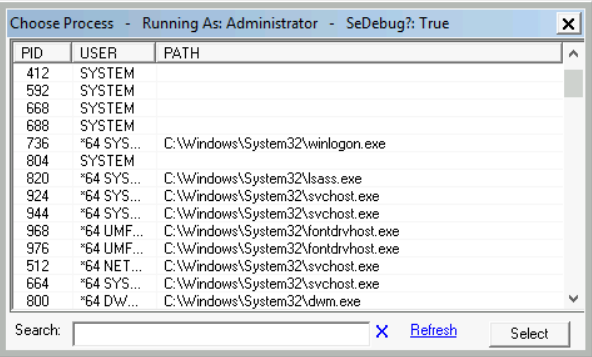
Once this is done, we can click Inject & Log to start the API logging process. API calls are logged on the lower pane and running processes on the upper one.
API Monitor
API Monitor provides more advanced information about a process’s API calls. It has a 32-bit and 64-bit version for each architecture of a process respectively. When API Monitor is open, we see the following window:
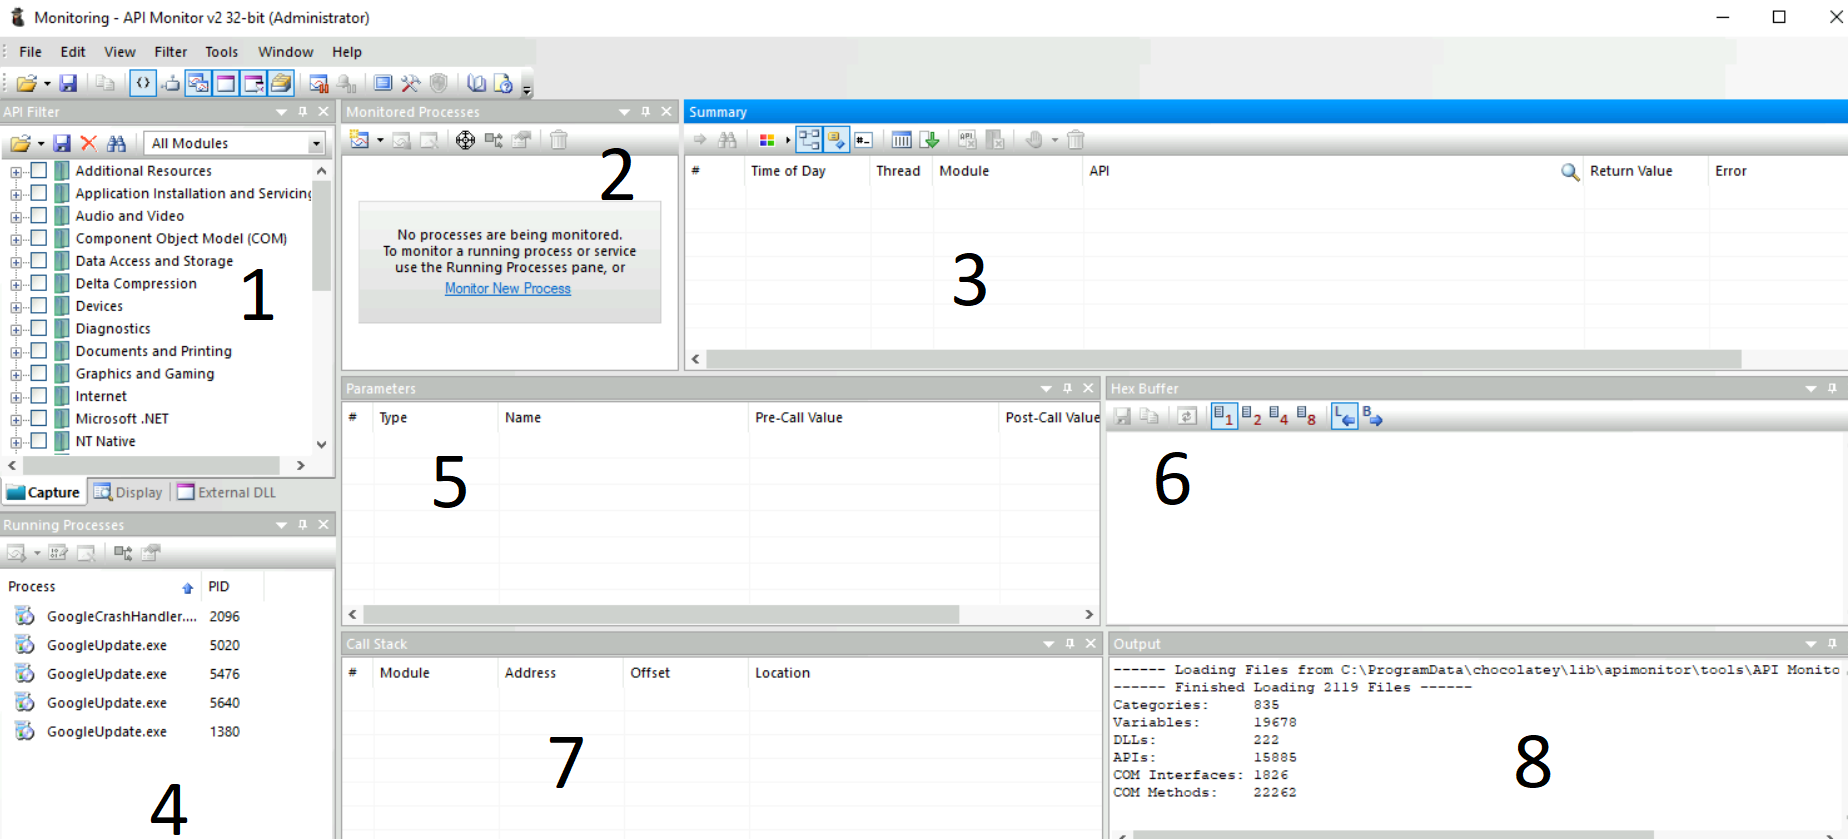
As we can see, API Monitor has multiple tabs, as numbered in the image above:
- This tab is a filter for the API group we want to monitor. For example, there is Graphics and Gaming related APIs, another one for Internet…
- This tab shows the processes being monitored for API calls. Monitor New Process option start monitoring a new process.
- This tab shows the API call, the Module, the Thread, Time, Return Value and any errors. We can monitor this tab for APIs called by a process.
- This tab show processes that can be monitored.
- This tab shows the Parameters of the API call, including those before and after the API processing.
- This tab show the Hex buffer of the selected value.
- This tab shows the Call Stack of the process.
- This tab shows the ouput.
To understand it better, let’s open a new process. This is what we get when we use the Monitor New Process option in tab 2:
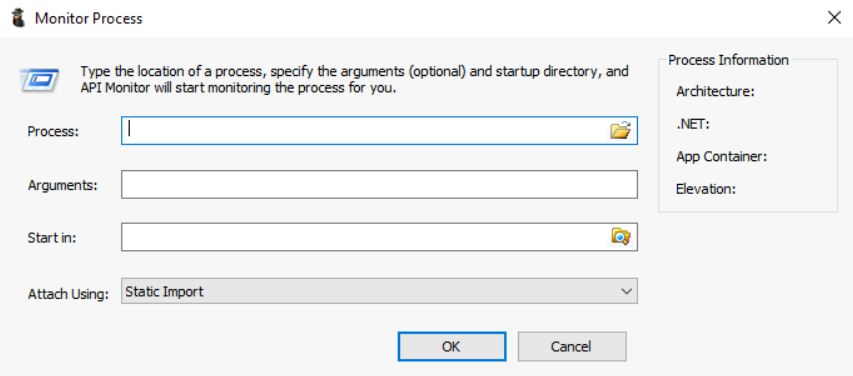
In this menu, we can select the process from a path, any arguments the process takes, the directory from where we want to start the process and the method for attaching API Monitor. Most of the time we can ignore the Arguments and Start option.
Once we open a process, we see the tabs populate as seen below:
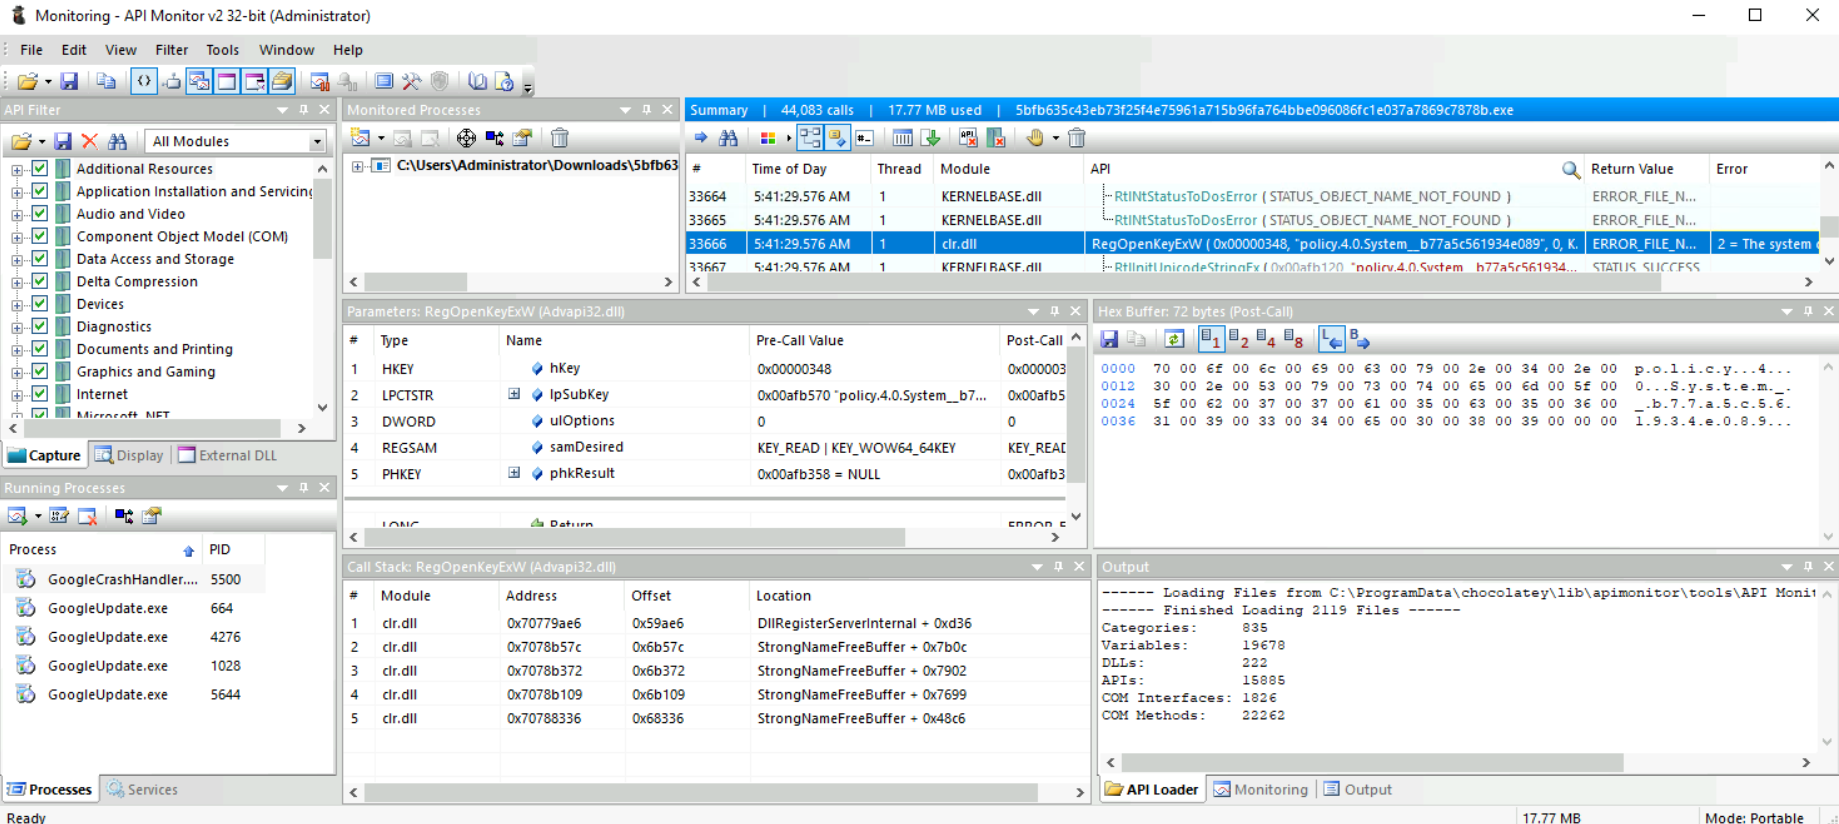
- In tab 1, we see the API filtering selecting all values to monitor all API calls.
- In tab 2, we see the path of the process we are monitoring.
- In tab 3, we see a summary of the API calls. The highlighted API call is
RegOpenKeyExW. Hence we know that the process tried to open a registry key and the result is an error which can be interpreted as registry key not found. - Tab 5 show tje parameters of the API call from before and after the API call was made.
- Tab 6 show the selected value in hex.
- Tab 7 show the Call Stack of the process.
We see that API Monitor provides us with much more information about API calls by a process than API Logger. However, we must slow down the analysis process to digest all this information. When analyzing malware, we can decide whether to use API Logger or API Monitor based on our needs.
Questions
The sample ~Desktop\samples\1.exe creates a file in the C:\ directory. What is the name with the full path of this file?
To start with, we are going to monitor this sample with APILogger beceause of it is more readable.
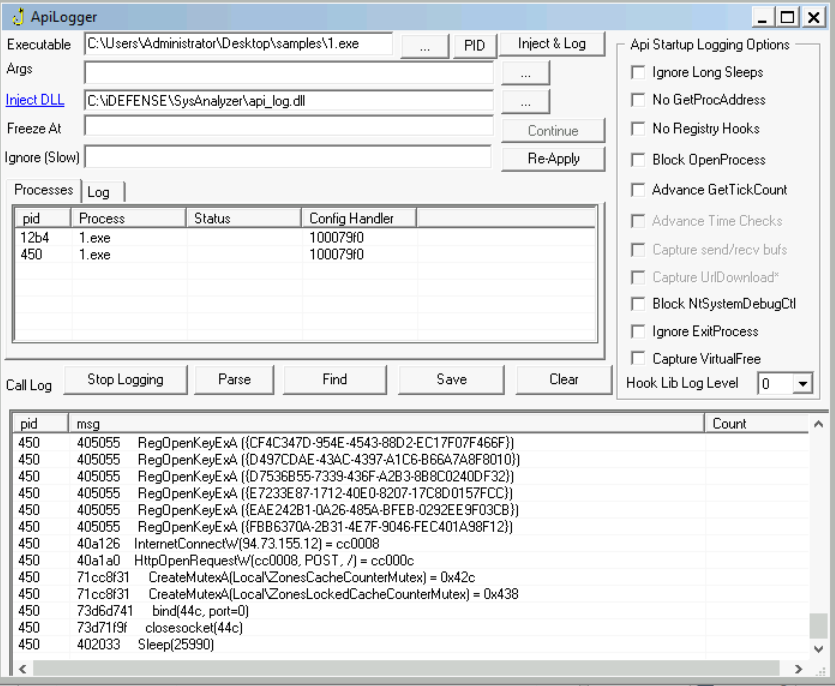
Answer: C:\myapp.exe
What API is used to create this file?
Answer: CreateFileA
In Question 1 of the previous task, we identified a URL to which a network connection was made. What API call was used to make this connection?
By looking a bit further on the logs, we can see the API calls made to create a connection with a unknown computer:
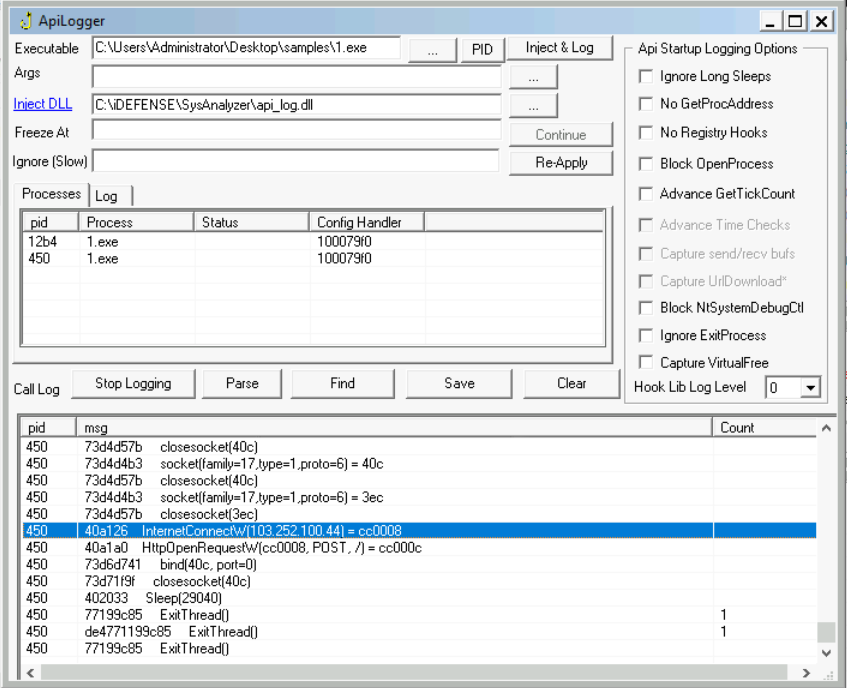
Answer: InternetConnectW
We noticed in the previous task that after some time, the sample’s activity slowed down such that there was not much being reported against the sample. Can you look at the API calls and see what API call might be responsible for it?
Futrthermore, we can also deduct a loop at the connection stage that is slowed down with sleep().

Answer: sleep
Task 5 - Process Explorer
Process Explorer is another tools from the Sysinternals Suite. It can be considered as an advanced Windows Task Manager that can help us identify process hollowing and masquereading techniques.
This is what Process Explorer looks like:
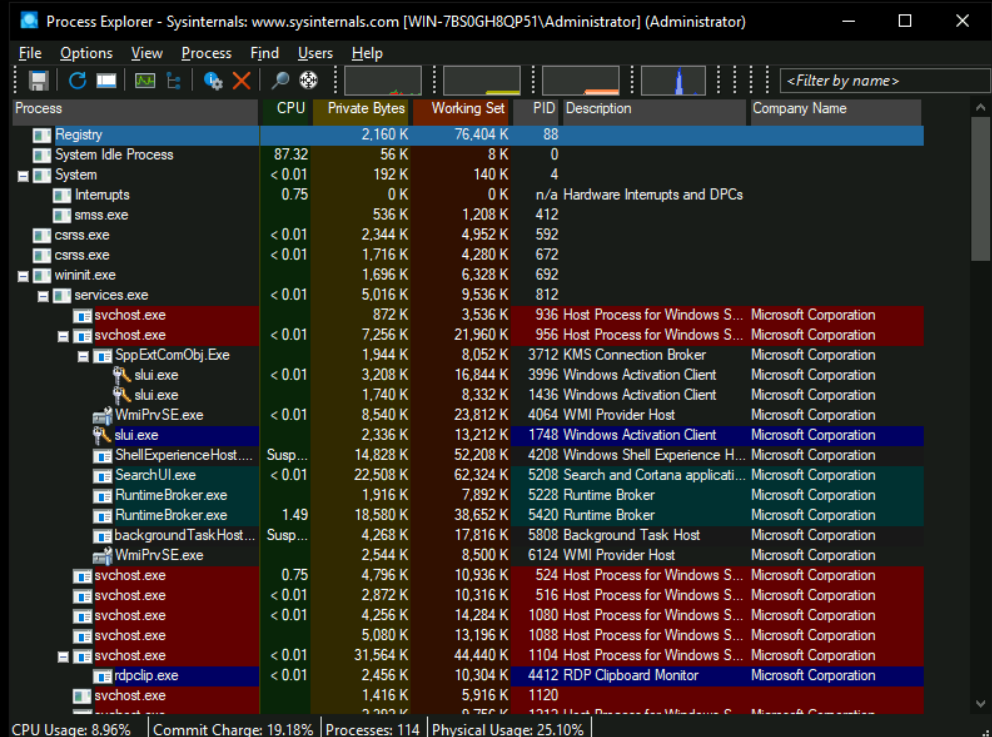
The above screenshot shows all the different processes running in the system in a tree format. We can see their CPU utilization, Memory usage, Process ID (PID), Description and Company Name.
We can enable the lower pane view from the View menu to find more information about the selected process. When enabled, we get the following screenshot:

On the lower pane, we can see details about the process, such as:
- Handles: References to various system ressources the process is using like threads, files, mutexes (mutual exclusions used to manage concurent access to ressources), semaphores (signaling between threads) or sections (memory sections or shared memory)…
- DLLs: Imported DLLs used by the process
- Threads: Part of a program that runs tasks at the same time as other parts.
By informing us about the ressources being used in the process, if a new process or thread in another process is opened by a process, it can indicate code injection into that process.
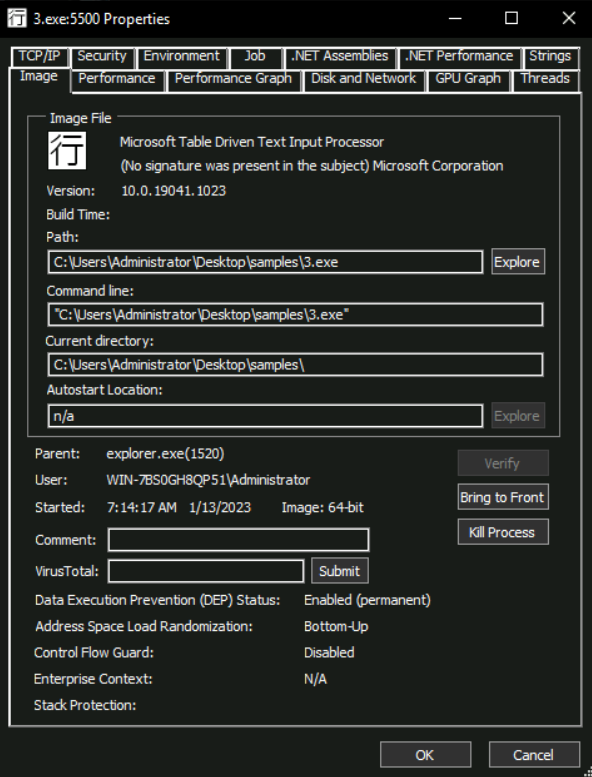
For more details about a selected process, we can look at the properties of the process. We can do that by right-clicking the process name in the process tree and selecting Properties. We should see something like this:

Process Masquereading
As seen in the above screenshot, the properties function show us a lot of information about a process in different tabs. Malware authors sometimes use process names similar to Windows legit ones or commonly used software to hide from an analyst’s prying eyes. The Image tab helps an analyst defeat this technique by clicking on the Verify button on this tab to identify if the executable for the running process is signed by the relevant organization, which shall be Microsoft in the case of Windows binaries.
In this particular screenshot, we see the text (No signature was present in the subject) Microsoft Corporation, which means although the executable claims to be from Microsoft, it is not digitally signed by them and is spoofing a Microsoft process. This can be an indication of a malicious process.
We must note that this verification only applies to the process’ image stored on the disk, hence a signed hollowed process migth still get a verified signature for that process. To identify hollowed process we have to look somewhere else.
Process Hollowing
Another technique used by malware is Process Hollowing, that means the malware binary hollow an already running legitimate process by removing all its code from its virtual memory and inject malicious code instead. This way, an analyst should see a legitimate process that run the code of a malware author.
To try to find this technique, we could use the String tab in a process’ properties like shown below:
At the bottom of the screenshot, we can choose Image and Memory options.
- Image: Shows strings present in the disk image of the process.
- Memory: Show strings extracted from the process’ memory.
Normally, strings contained in the image should be the same as the process located in memory. However, we should see a significant difference between these two in an hollowed process.
Questions
What is the name of the first Mutex created by the sample ~Desktop\samples\1.exe? If there are numbers in the name of the Mutex, replace them with X.
Firstly, we need to open the lower pane and Handles tab after executing the binary. By scrolling down a bit, it shows the different mutexes:
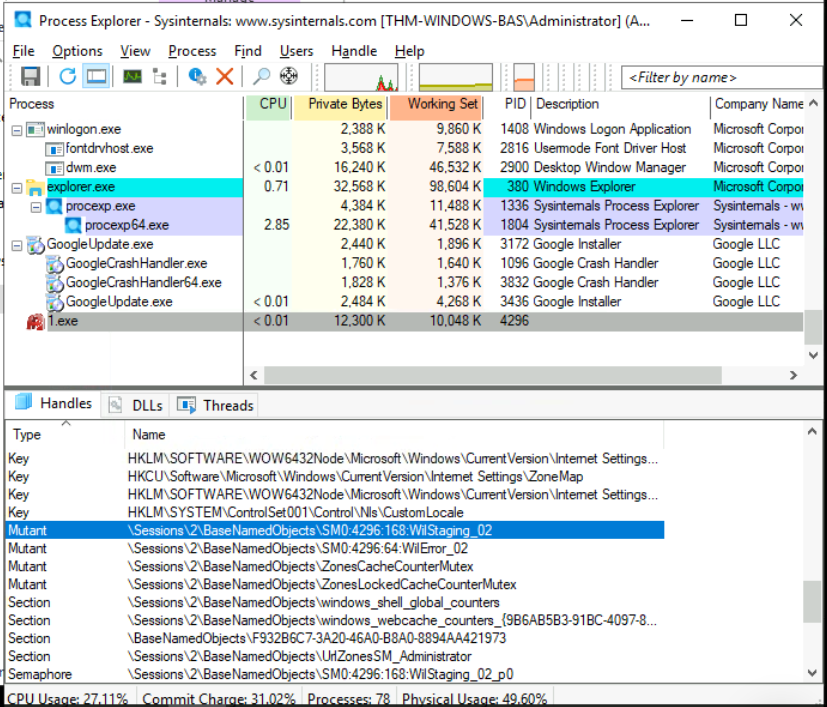
Answer: \Sessions\X\BaseNamedObjects\SMX:XXXX:XXX:WilStaging_XX
Is the file signed by a known organization? Answer with Y for Yes and N for No.
In order to check the signature, we will go into the 1.exe properties:
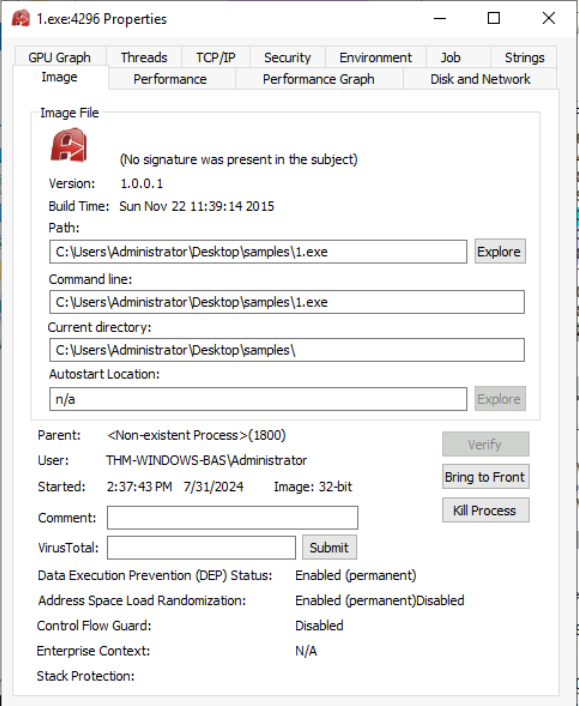
Answer: N
Is the process in the memory the same as the process on disk? Answer with Y for Yes and N for No.
To check if the process is being hollowed out, we have to see the process’ strings:
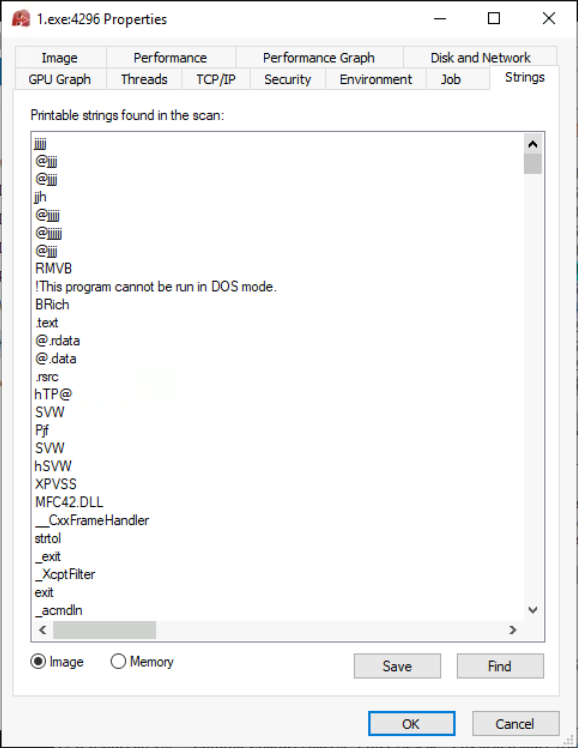
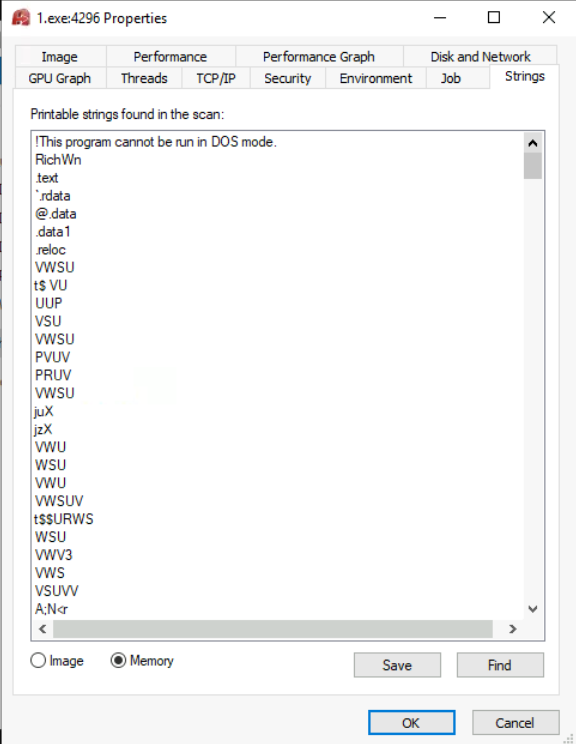
As we see, the process might not being hollowed out but the binary file might be packed.
Answer: N
Task 6 - Regshot
Regshot is a tool that identfies any changes to the registry (or filesystem we select). It is mainly used to identify what registry keys were created, deleted or modified during our dynamic analysis.
Regshot works by taking snapshots of the registry before and after the execution of malware to compare them and identify the differences between the two.
When we execute Regshot, we see the following interface:
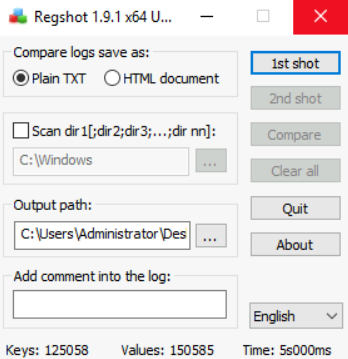
In this simple interface, we can also scan for change in the filsystem if we select the scan dir1 option. However, only registry changes will be covered here.
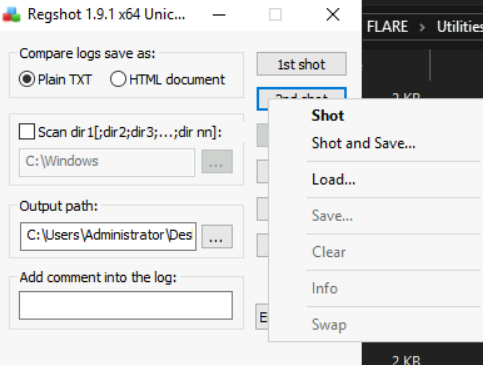
To start, we can click on 1st shot option. It will ask us whether to take a shot or take a shot and save. Once the first shot is taken, we should see something like below:
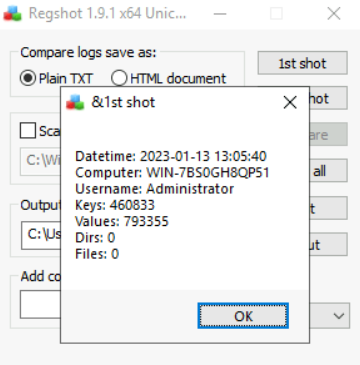
Now we have saved a shot of the registry, we can execute the malware. Once the malware has been executed sucessfully, we take a 2nd shot.
Now, we should be able to compare and see significant changes done to the registry by the malware. Using the Compare button, a summary box should appear:
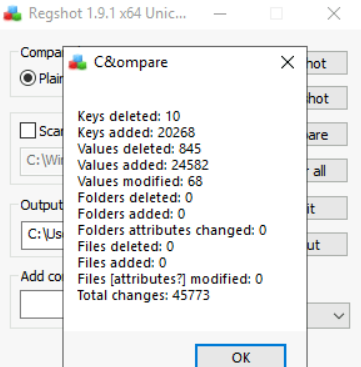
While the summary show Keys and Values that were added, deleted and modified to the registry, it also show changes done to the Files and Folders. However, since we have not checked the Scan dir1 option, zero changes appear. Changes would appear if this box was activated.
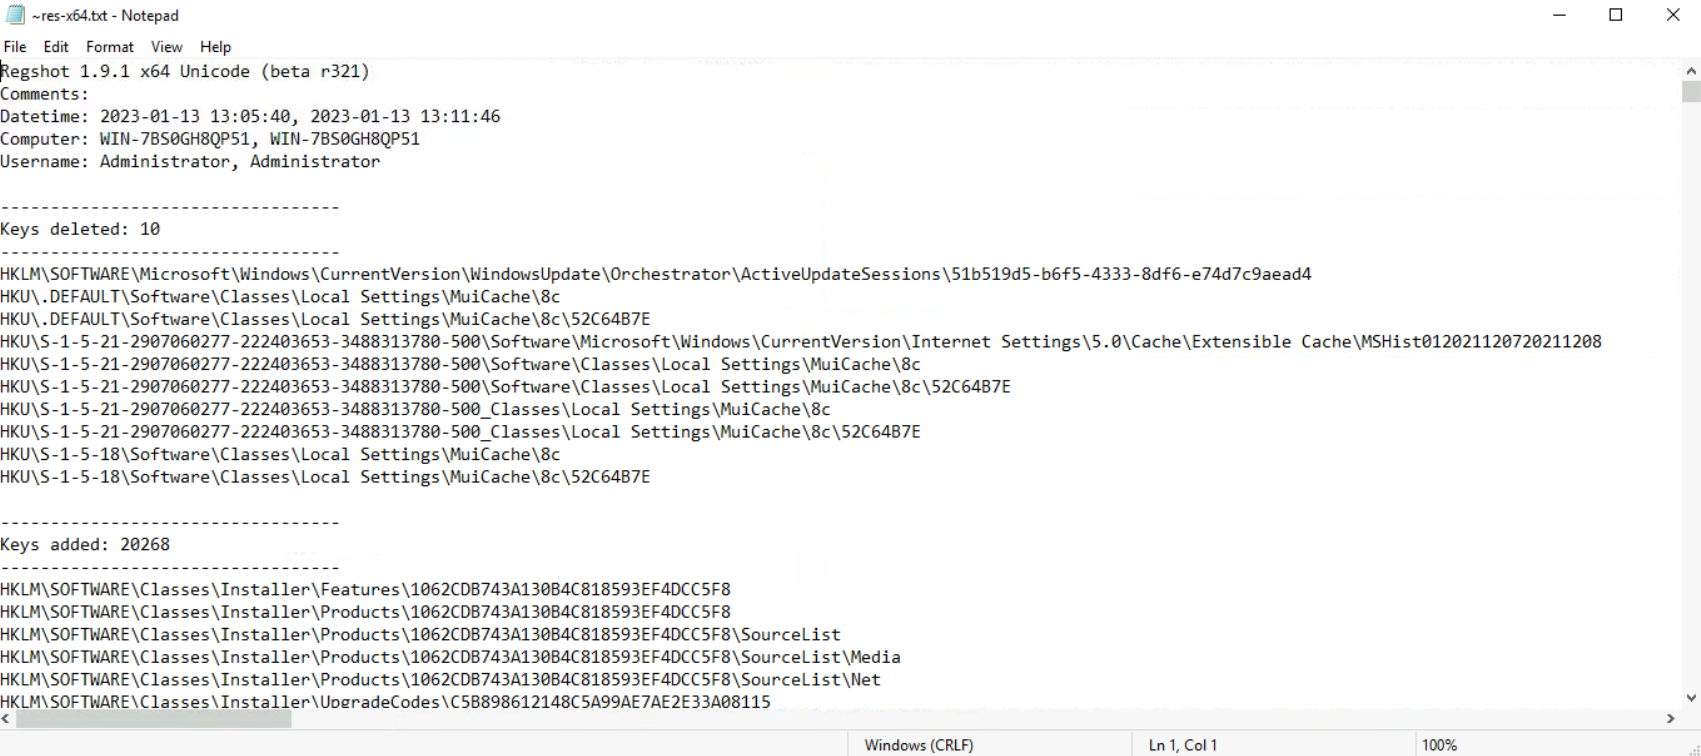
To save the results, we have to go to Compare > Output. It provides the date and time of the shots, the computer name, the username and regshot’s version.
Once advantage that Regshot enjoys over all tools discussed in this room is that it doesn’t need to be running when we execute the malware, by being able to save the shot before. Some malware can check all the running processes and shut down if any analysis tool is running like ProcExp, Procmon or API Monitor. They check for them before running the rogue payload and quitting if these are found.
Its core mechanism makes it immune to detection evasion. However, we must ensure that no other processes is running in the background while perofrming analysis with regshot, as there is no filtering mechanism, like in the other tools. Hence, any noise created by background process will also be recorded by Regshot, resulting in False Positives.
Question
Analyze the sample ~Desktop\Samples\3.exe using Regshot. There is a registry value added that contains the path of the sample in the format *HKU\S-X-X-XX-XXXXXXXXXX-XXXXXXXXXX-XXXXXXXX-XXX*. What is the path of that value after the format mentioned here?
Firstly, we need to run regshot and take a 1st shot of our system state.
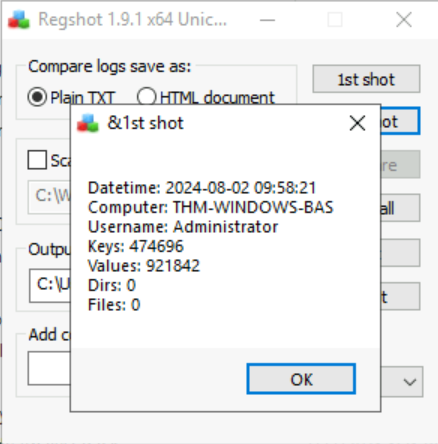
Then, we run the malware 3.exe. We should be able to see it in procexp or procmon beceause it does not do some Evasion Detection.
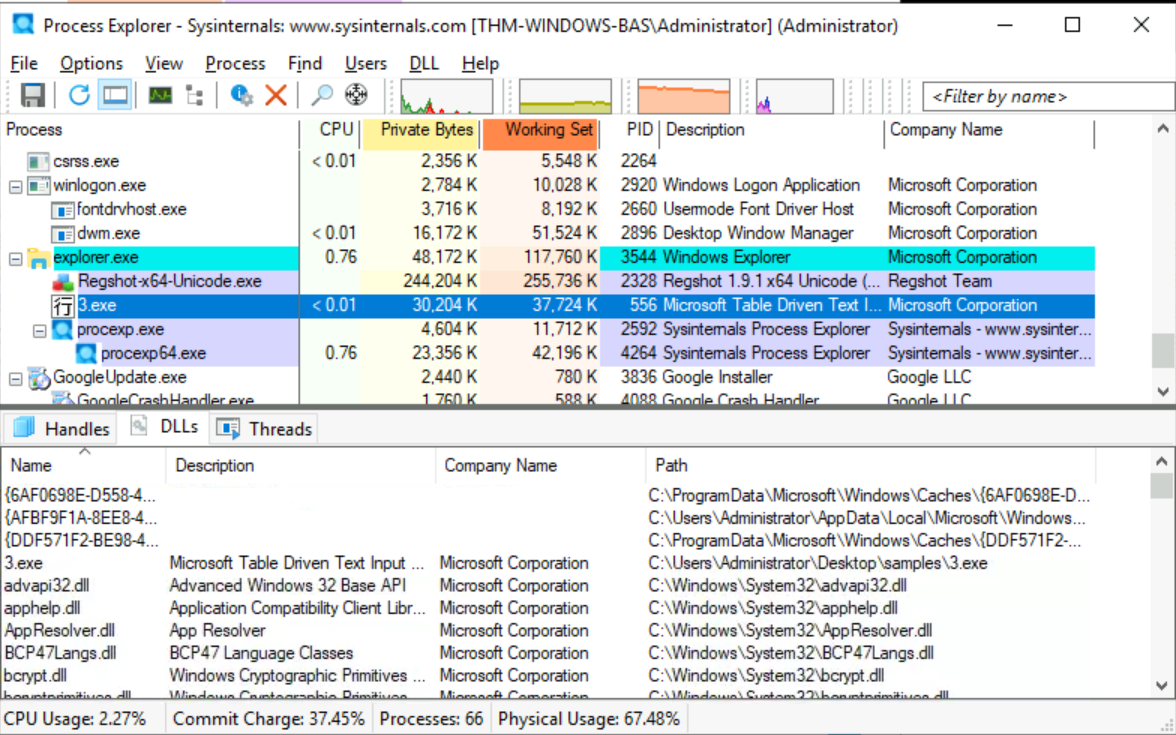
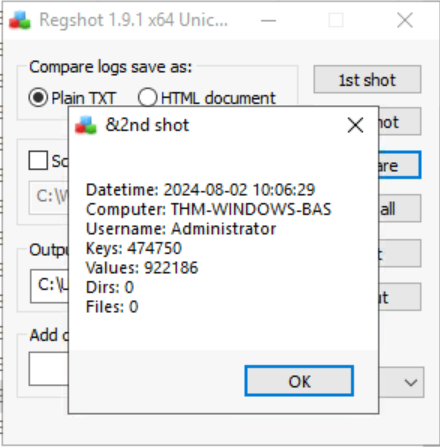
After doing a second shot, we get a new summary window about it:
Finally, we compare using the corresponding button and we check for the requested regkey starting with HKU:

Answer: Software\Microsoft\Windows NT\CurrentVersion\AppCompatFlags\Compatibility Assistant\Store\C:\Users\Administrator\Desktop\samples\3.exe
Task 7 - Conclusion
To conclude, in this room we have learned how to monitor a proccess’ activites using ProcMon and filter out other process to focus on the process of our interest and how to identify what API calls a process is making ot identify the behaviour of the process. Moreover, we tried to figure out if a malware asmple is trying to evade detection by performing Process Masquerading or Process Hollowing using Process Explorer, and we identified changes in the registry made by malware using Regshot.
Furthermore, we must understand that malware analysis requires perseverance, persistance, and attention to details since malware authors will always try to twart an analyst’s efforts. What we have covered so far is not enough to analyze the most advanced malware, hence we will cover more advanced trick in Dynamic Analysis: Debugging.
Enjoy Reading This Article?
Here are some more articles you might like to read next: