THM Anti-Reverse Engineering
Task 1 - Introduction
To start with, malware authors are constantly looking to improve their malware by implementing new ways of evading detection. On the other hand, analysts are working on new methods to uncover these. This mouse and cat game lead to the development of increasingly sofisticated technique implementations and discover protocols.
Reverse engineering is the process of studying a product, software or hardware, to understand how it works and extracting its functionalities and design. Here, in cybersecurity, RE (Reverse Engineering) is used on binaries to extract Indicators of Compromise (IOC) and develop adequate countermeasures.
In this room, we will explore about some anti-reverse engineering techniques malware uses like:
- VM Detection
- Obfuscation using packers
- Anti-debugging
Learning Objectives
- Why malware authors use anti-reverse engineering techniques
- Learn about different anti-RE techniques
- How to circumvent these using various tools
- How they are implented by reading source code
Prerequisties
- Familiarity with Basic / Advanced Dynamic Analysis.
- Knowledge of assembly (Registers, Stack, Operands…)
- Basic understating of C programming concepts
Task 2 - Anti-Debugging (Overview)
Debugging is the process of examining software in order to understand its inner workings and identify potential flaws and vulnerabilities. Consequently, this involves programs called debuggers, with most used ones nowadays are:
- X32/X64dbg
- Ollydbg
- IDA pro
- Ghidra
Anti-debugging techniques used by malware authors are plentiful and below is a summary of many of them:
| Anti-Debugging Technique | Explanation |
|---|---|
| API-Based Detection | Uses system APIs like IsDebuggerPresent() or NtQueryInformationProcess() to detect debuggers. |
| Timing Attacks | Measures execution time of instructions; delays indicate the presence of a debugger. |
| Breakpoint Detection | Scans for hardware and software breakpoints (e.g., 0xCC opcode) set by debuggers. |
| Exception-Based Techniques | Exploits how debuggers handle exceptions (e.g., division by zero or single-step exceptions). |
| Self-Debugging | Malware debugs itself, preventing another debugger from attaching to the process. |
| PEB Manipulation | Checks BeingDebugged and NtGlobalFlag flags in the Process Environment Block for signs of debugging. |
| Anti-Attachment Techniques | Makes it difficult for debuggers to attach, often through process spawning or modifying debugger behavior. |
| Code Obfuscation | Obscures the code to prevent easy analysis, using opaque predicates, inline functions, or anti-disassembly. |
| Anti-VM Techniques | Detects virtual machines (common in malware analysis) using CPUID, hardware, or BIOS checks. |
| Thread Hiding Techniques | Uses NtSetInformationThread() to hide threads from the debugger. |
| Dynamic Code Loading | Loads or decrypts code only at runtime, preventing static analysis and debugging. |
| Process Forking | Spawns child processes and transfers execution, leaving the debugger attached to the inactive parent process. |
| Kernel Debugger Detection | Checks for kernel-level debugging using flags like KdDebuggerEnabled or special I/O control queries. |
| Deliberate Crashes | Intentionally crashes or corrupts memory to disrupt debugger operation and analysis. |
| Stack Frame Manipulation | Alters or destroys stack frames to confuse the debugger and make execution tracing difficult. |
| Anti-Step Techniques | Confuses debugger step commands by injecting or redirecting code execution to non-linear addresses. It modifies the program flow of itself while runnning. |
Questions
What is the name of the Windows API function used in a common anti-debugging technique that detects if a debugger is running?
Answer: IsDebuggerPresent
Task 3 - Anti-Debugging using Suspend Thread
SuspendThread is a Windows API function used to pause the execution of a thread in a running process. Besides its main purpose, a malware process uses this function to suspend itself if it recognizes being debugged.
The provided code snippet in this room to conceptualize the idea of suspending the thread if a debugger is found is the following:
#include <windows.h>
#include <string.h>
#include <wchar.h>
#include <tlhelp32.h>
#include <stdio.h>

DWORD g_dwDebuggerProcessId = -1;

BOOL CALLBACK EnumWindowsProc(HWND hwnd, LPARAM dwProcessId)
{
    DWORD dwWindowProcessId;
    GetWindowThreadProcessId(hwnd, &dwWindowProcessId);

    if (dwProcessId == dwWindowProcessId)
    {
  int windowTitleSize = GetWindowTextLengthW(hwnd);
  if ( windowTitleSize <= 0 )
  {
   return TRUE;
  }
  wchar_t* windowTitle = (wchar_t*)malloc((windowTitleSize + 1) * sizeof(wchar_t));

        GetWindowTextW(hwnd, windowTitle, windowTitleSize + 1);

  if (wcsstr(windowTitle, L"dbg") != 0 ||
   wcsstr(windowTitle, L"debugger") != 0 )
  {
            g_dwDebuggerProcessId = dwProcessId;
   return FALSE;
  }

       return FALSE;
    }

    return TRUE;
}

DWORD IsDebuggerProcess(DWORD dwProcessId)
{
    EnumWindows(EnumWindowsProc, (LPARAM)dwProcessId);
    return g_dwDebuggerProcessId == dwProcessId;
}

DWORD SuspendDebuggerThread()
{
 HANDLE hSnapshot = CreateToolhelp32Snapshot(TH32CS_SNAPTHREAD, 0);
    if (hSnapshot == INVALID_HANDLE_VALUE)
 {
        printf("Failed to create snapshot\n");
        return 1;
    }

    THREADENTRY32 te32;
    te32.dwSize = sizeof(THREADENTRY32);

    if (!Thread32First(hSnapshot, &te32))
 {
        printf("Failed to get first thread\n");
        CloseHandle(hSnapshot);
        return 1;
    }

    do
 {
        HANDLE hThread = OpenThread(THREAD_QUERY_INFORMATION | THREAD_SUSPEND_RESUME, FALSE, te32.th32ThreadID);
        if (hThread != NULL)
  {
            DWORD dwProcessId = GetProcessIdOfThread(hThread);
   if ( IsDebuggerProcess(dwProcessId) )
   {
    printf("Debugger found with pid %i! Suspending!\n", dwProcessId);
    DWORD result = SuspendThread(hThread);
     if ( result == -1 )
    {
     printf("Last error: %i\n", GetLastError());
    }
   }
            CloseHandle(hThread);
        }
    } while (Thread32Next(hSnapshot, &te32));

    CloseHandle(hSnapshot);

    return 0;
}

int main(void)
{
 SuspendDebuggerThread();

 printf("Continuing malicious operation...");
 getchar();
}
In short, this source code would be doing this when running:
- It enumerates every thread in the Windows system
- For each thread, it uses EnumWindow to get their window title.
- If one of these has
debuggerordbgin their title, the malware knows a debugger is running. - When the debugger has been discovered, the malware calls
SuspendThreadto stop the debugger from running, which makes it crash. - Therefore, the malware continues its activity.
Patching
Pathcing is one of most critical skill required by an analyst. It lets us change the behavior of the binary by changing its instructions.
On the program called suspend-thread.exe, based on the code snippet available above, we will patch the debugger-checking technique to bypass it using x32dbg.
To begin with, we will use the run button or F9 to get to the entry point.

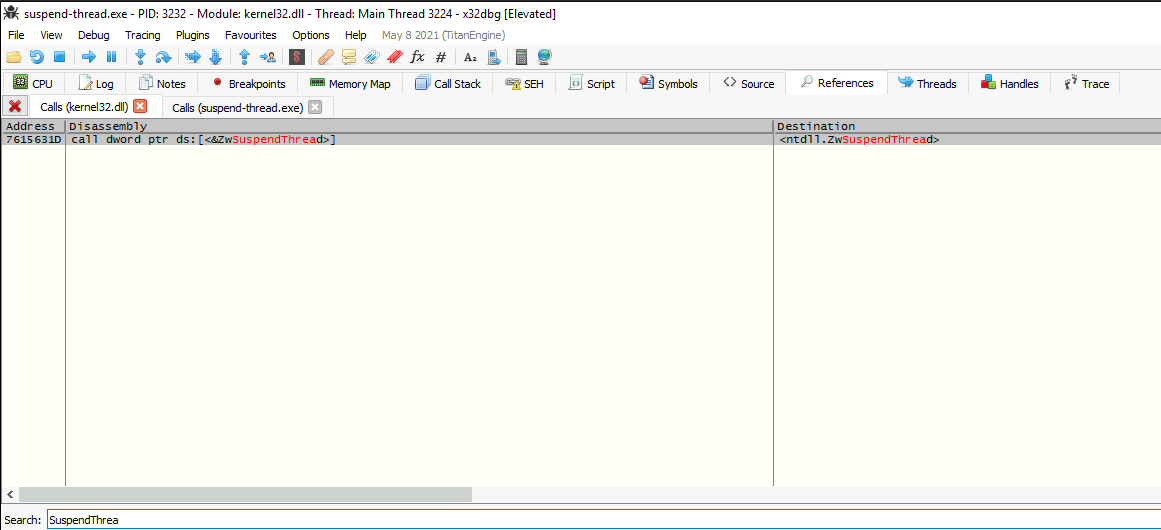
Then, we can Right click -> Search for -> This module -> Intermodular Calls. This will redirect us to the call made by the program.
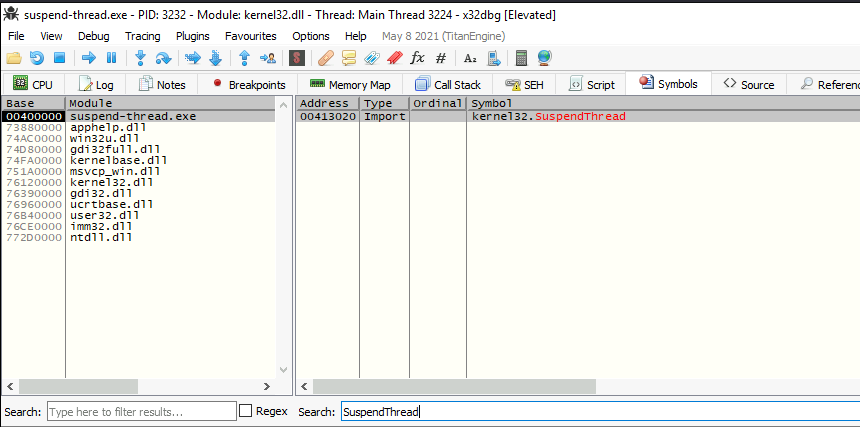
If we would go to Symbols -> Click on “suspend-thread.exe” -> Search “SuspendThread”, we would be redirected to where the function really is.
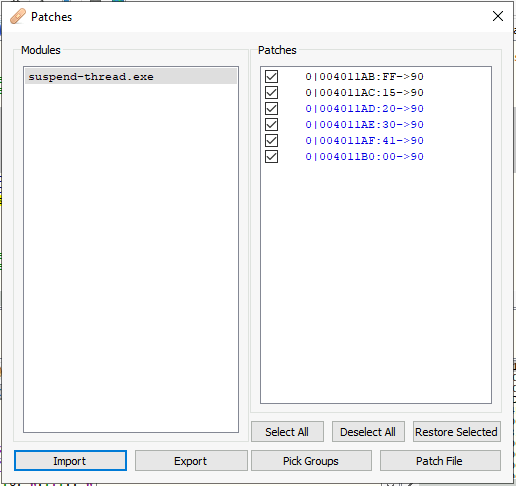
After doing the first trick, we remove the function call by filling the function with NOPs (No Operation opcode) by doing Right click on the operation -> Binary -> Fill with NOPs. The hex value for opcode nop is 90.

Subsequently, in order to apply our patch forever on the binary, we may click on File -> Patch file or Ctrl+P. Then we click on Patch file and save the program.
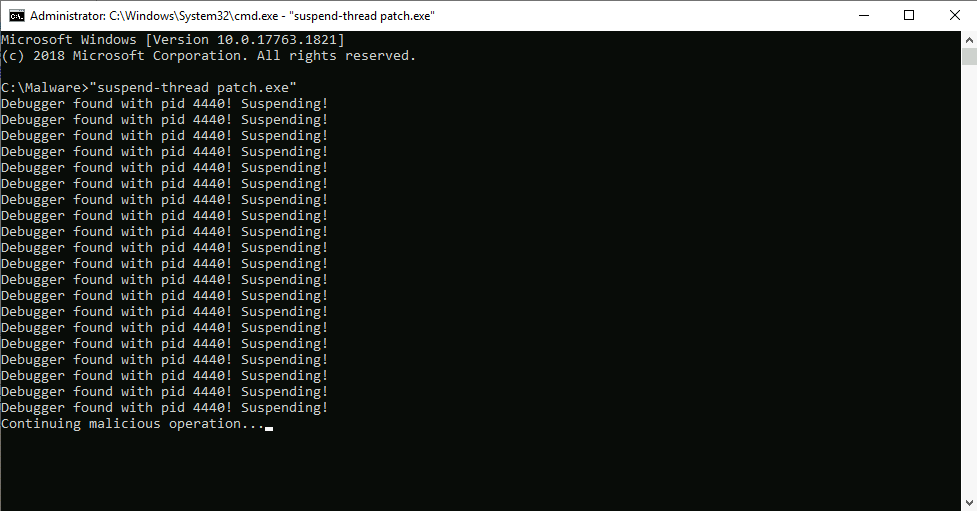
Now, if we run the program, we will get the “Debugger found with PID XXXX! Suspending!” message. However, it won’t suspend the thread as we erased the SuspendThread() call.
Questions
What is the Windows API function that enumerates windows on the screen so the malware can check the window name?
Answer: EnumWindows
What is the hex value of a nop instruction?
Answer: 90
What is the instruction found at memory location 004011CB?
On x32dbg, do Right click -> Go to -> Expression or hit Ctrl+G, then write the memory address.
Answer: add esp,8
Task 4 - VM Detection (Overview)
Virtual Machines are software platforms that emulates a computer environment inside another computer. These are useful in reverse engineering because they provide a cost-effective, controlled and isolated environment for monitoring and analyzing suspicious software or malware. They also allow the creation of snapshots/checkpoints that can be used to restore the system to a previous state, which helps test different scenarios and maintain an history of the analysis process.
When malware identifies that it is running on a VM, it may decide to respond differently, for example:
- Executing a minimal subset of its functionnality
- Self-destructing or code parts overwriting
- Cause damage to the system
- Not run at all
Detection Techniques
Malware can employ various techniques to detect a Vm environment such as:
| Detection Technique | Explanation |
|---|---|
| Checking running processes | VMs have easily identifiable processes; for example, VMWare runs a process called vmtools, while VirtualBox has vboxservice. Malware can use the EnumProcess Windows API to list all the processes running on the machine and look for the presence of these tools. |
| Checking installed software | Malware can look in the Windows Registry for a list of installed software under the SOFTWARE\\Microsoft\\Windows\\CurrentVersion\\Uninstall Registry key. From here, it can check for installed programs like debuggers, decompilers, forensics tools, etc. |
| Network fingerprinting | Malware can look for specific MAC and network addresses unique to VMs. For example, VMs autogenerate MAC addresses that start with any of the following numbers: 00-05-69, 00-0c-29, 00-1c-14 or 00-50-56. These numbers are unique and are specifically assigned to a VM vendor called the OUI (Organizationally Unique Identifier). |
| Checking machine resources | Malware can look at a machine’s resources like RAM and CPU Utilization percentages. For example, a machine with RAM amounting to less than 8GB can indicate a virtual machine, as they are typically not assigned a significant amount. |
| Detecting peripherals | Some malware checks for connected printers because this is rarely configured properly on VMs, sometimes not even configured at all. |
| Checking for domain membership | Corporate networks are a usual target for malware. An easy way to determine this is by checking if the current machine is part of an Active Directory domain. This can quickly be done without the use of API calls by checking the LoggonServer and ComputerName environment variables. |
| Timing-based attacks | Malware can measure the time it takes to execute specific instructions or access particular machine resources. For example, some instructions can be faster on a physical machine compared to a virtual machine. |
Anti-VM Detection
To prevent malware using some of the techniques above, we can apply several cahnges that will remove VM-related artefacts. For example, registry entries or MAC Address modifications can bypass some of them, however, it can become tedious to protect us from everything.
Some scripts or videos are available to help automate this process, which some are listed below:
- Eric Parker’s video “Setting up an UNDETECTABLE VM for Malware analysis”
- Ludovic Coulon’s blog post based on Eric Parker’s Video
- VMWareCloak
- VBoxCloak
- VMWare-Hardened-Loader
A known tool to test the efficiency of the anti-vm changes made is pafish. It is a testing tool that uses different techniques to detect virtual machines and malware analysis environments in the same way that malware families do.
Questions
What is the name of the identifiable process used by malware to check if the machine is running inside VirtualBox?
Answer: vboxservice
What is the OUI automatically assigned specifically to VMware?
Answer: 00:50:56
Using Task Manager, what process indicates that the machine for this room is an Amazon EC2 Virtual Machine?
Answer: amazon-ssm-agent.exe
Task 5 - VM Detection by Checking the Temperature
Win32_TempereatureProbe is a Windows Management Instrumentation (WMI) class that conatins real-time temperature readings from the hardware through the SMBIOS (System Management BIOS) data structure. In a virutalized environment, the returned value is Not Supported, which is what malware looks for.
WMI is a feature to gather detailed system information such as hardware configuration, OS status, installed software, network settings, running processes and more, which allows management and monitoring on both local and remote systems.
Note:
Win32_TemperatureProbemay also returnNot Supportedeven on physical machines which doesn’t support the SMBIOS feature. This makes it unreliable but valuable when used with other techniques mentioned previously.
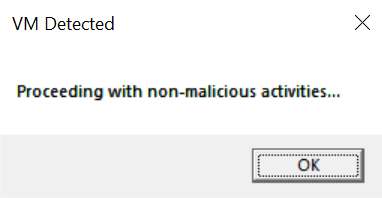
The binary named vm-detection.exe behaves as proceeding with non-malicious activities when executed in a VM.
Thus, it proceeds with malicious ones when executed on a physical machine.
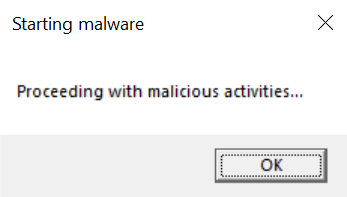
The code snippet is available below:
#include <stdio.h>
#include <windows.h>
#include <wbemidl.h>
#include <combaseapi.h>

#pragma comment(lib, "wbemuuid.lib")
#pragma comment(lib, "user32.lib")
#pragma comment(lib, "ole32.lib")
#pragma comment(lib, "oleaut32.lib")

BOOL hasThermalZoneTemp();

int main()
{
 if ( !hasThermalZoneTemp() )
 {
  MessageBox(NULL, "Proceeding with non-malicious activities...", "VM Detected" , MB_OK);
  return 0;
 }

 MessageBox(NULL, "Proceeding with malicious activities...", "Starting malware", MB_OK);
 return 0;
}

BOOL hasThermalZoneTemp()
{
 IWbemLocator* pLoc = NULL;
 IWbemServices* pSvc = NULL;
 IEnumWbemClassObject* pEnumerator = NULL;
 IWbemClassObject* pclsObj = (IWbemClassObject*)malloc(sizeof(IWbemClassObject));

 ULONG uReturn = 0;

 HRESULT hr = CoInitializeEx(0, COINIT_MULTITHREADED);
 hr = CoInitializeSecurity(NULL, -1, NULL, NULL, RPC_C_AUTHN_LEVEL_DEFAULT, RPC_C_IMP_LEVEL_IMPERSONATE, NULL, EOAC_NONE, NULL);
 hr = CoCreateInstance(CLSID_WbemLocator, NULL, CLSCTX_INPROC_SERVER, IID_IWbemLocator, (LPVOID*)&pLoc);
 hr = pLoc->ConnectServer(L"root\\wmi", NULL, NULL, 0, NULL, 0, 0, &pSvc);
 hr = CoSetProxyBlanket(pSvc, RPC_C_AUTHN_WINNT, RPC_C_AUTHZ_NONE, NULL, RPC_C_AUTHN_LEVEL_CALL, RPC_C_IMP_LEVEL_IMPERSONATE, NULL, EOAC_NONE);
 hr = pSvc->ExecQuery(L"WQL", L"SELECT * FROM MSAcpi_ThermalZoneTemperature", WBEM_FLAG_FORWARD_ONLY | WBEM_FLAG_RETURN_IMMEDIATELY, NULL, &pEnumerator);

 while (pEnumerator)
 {
  hr = pEnumerator->Next(WBEM_INFINITE, 1, &pclsObj, &uReturn);
  if (uReturn == 0)
  {
   return 0;
  }

  VARIANT vtProp;

  hr = pclsObj->Get(L"CurrentTemperature", 0, &vtProp, 0, 0);
  if (SUCCEEDED(hr))
  {
   printf("Thermal Zone Temperature: %d\n", vtProp.intVal);
   return 1;
  }

  VariantClear(&vtProp);
  pclsObj->Release();
 }

 pEnumerator->Release();
 pSvc->Release();
 pLoc->Release();

 CoUninitialize();

    return 0;
}
Preventing Temperature Checking
While we could patch a function with nop to prevent it from being called, instead we will manipulate memory directly and change the execution flow with EIP (RIP in x64).
Firstly, we will jump straight to the EntryPoint of the program.

Secondly, we need to go to uReturn, which is the variable that indicates if the query has returned a class or not (the Not Supported). For that, we can try to go near it by searching for strings and go to the address location with the SELECT * FROM MSAcpi_ThermalZoneTemperature string.
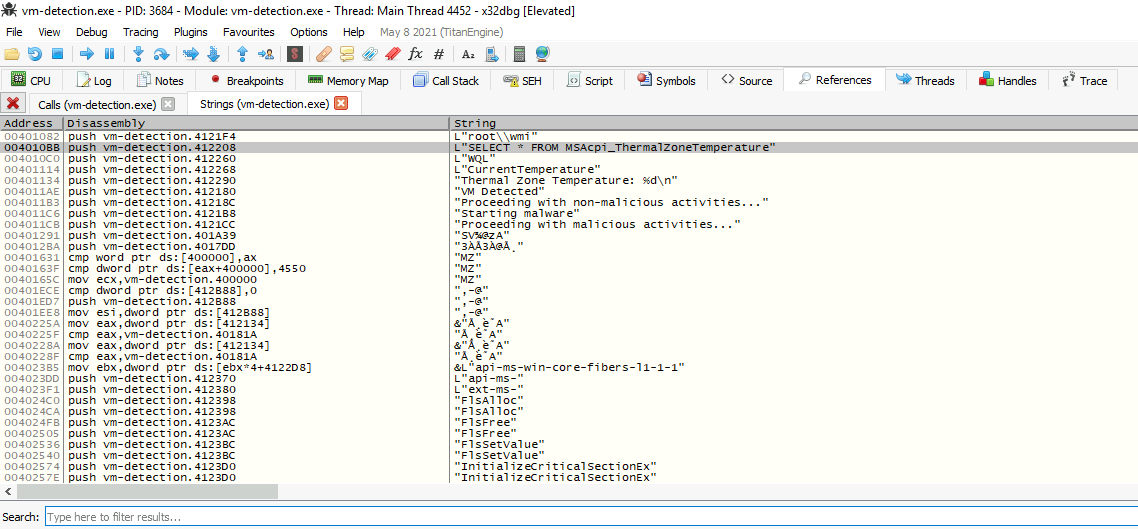
When we got there, we can observe a part which corresponds to pEnumerator->Next(WBEM_INFINITE, 1, &pclsObj, &uReturn);.

As we press F8 (Step Over), we eventually get at the address 004010FD, which is where the comparison uReturn == 0 is made:

Since uReturn has the address ebp-18 and because we want to modify that value to bypass that jump, we will follow it on dump by Right clicking on the opcode cmp -> Follow in Dump -> Address: EBP-18.
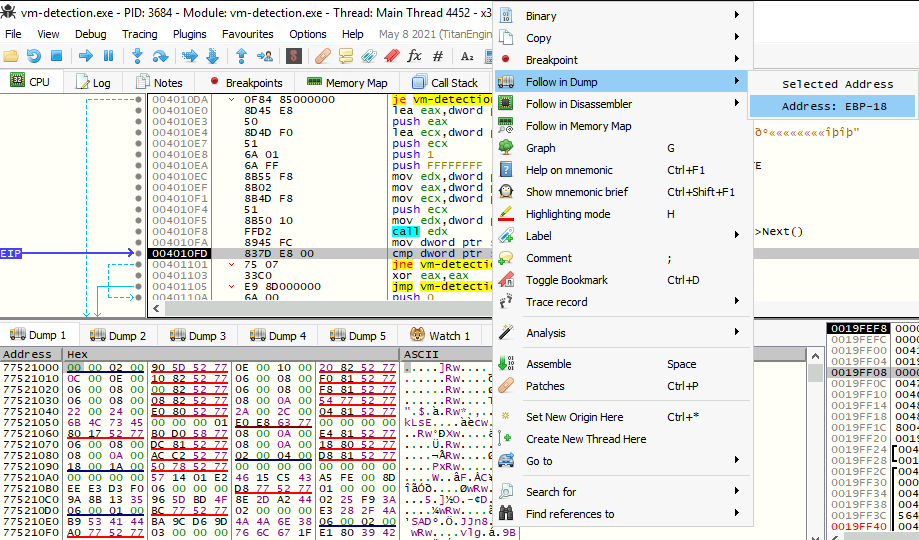
On the bottom of the screen at Dump 1, we can see our current value uReturn (it is a 32-bit integer):
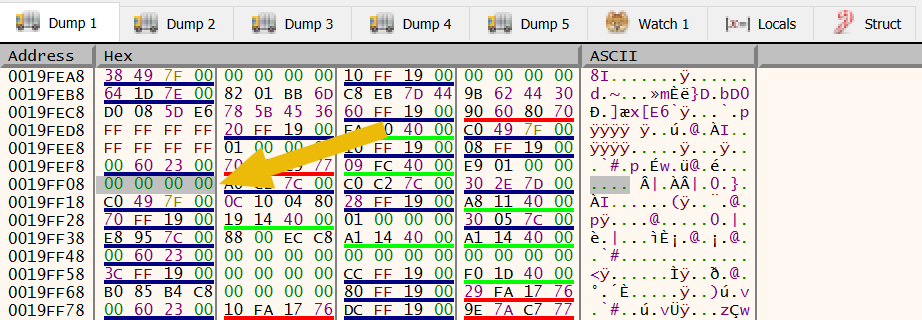
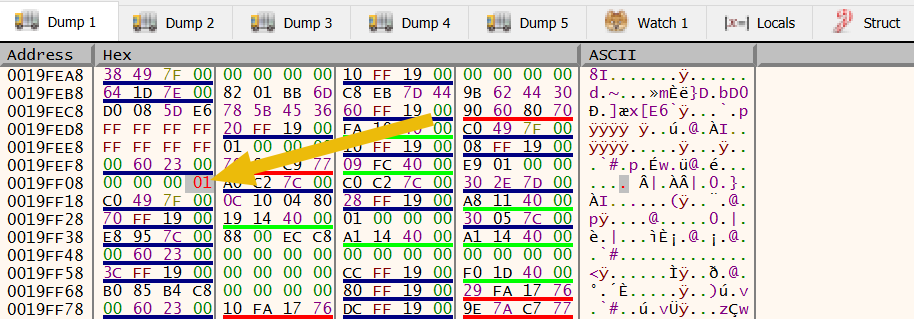
Right-clicking on the least-significant 00 value (the one at the rightmost, because of the endianness) will open a Modify Value window. We enter the value 01.
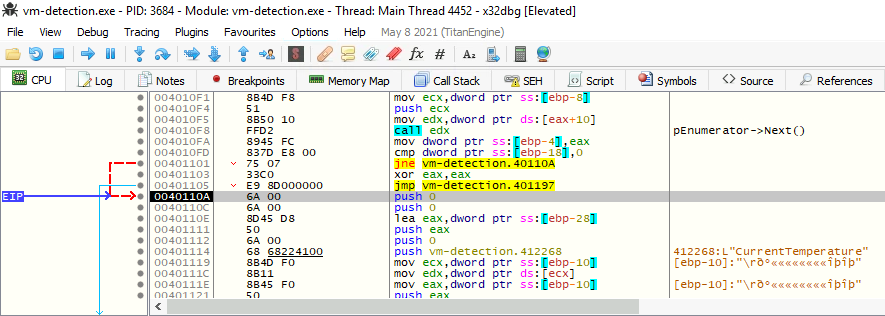
After pressing F8 a few times, we should notice that the code will not exit anymore as it skips the execution from 00401101 to 0040110A. This is because we have manipulated the memory.
However, the program will crash if we continue the execution as the pclsObj pointer is not pointing to any valid object. This is throwing the EXCEPTION_ACCESS_VIOLATION exception as the program wants to execute pclsObj->Get(L"CurrentTemperature", 0, &vtProp, 0, 0); and want to access to an unauthorized memory allocation, a memory location which hasn’t been allocated for the program.
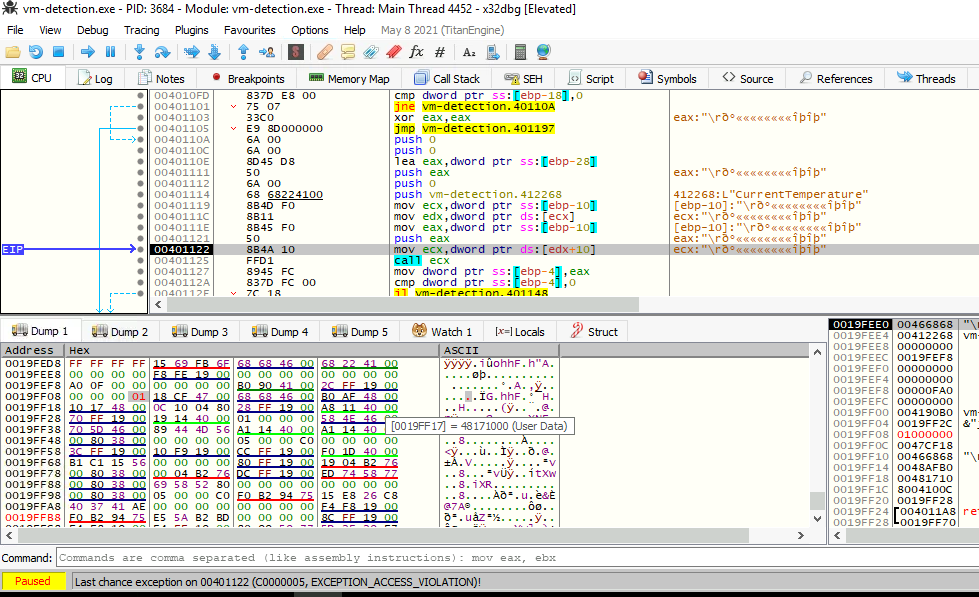
Afterward, we need to continue to investigate with other methods that would allow us to jump around and continue.
Here, we have two other ways to make this happen:
- Changing the
EIPregister’s value - Modifying the
jmpto go to where the malicious activities are “being done” or where 1 is returned
For the first one, the great thing with debuggers is that we can change every value related to the program, the ones in the memory, in the stack, in the registers… Because EIP is the register that holds the memory address that tells what instruction next to execute, we can modify it to hold the memory address where the return is being made.
To skip everything and jump to the part where it returns, we need to modify the EIP value to 0x00401134 after running the program to the address 0x00401101 (where the uReturn check is).

To modify it, it is simple as Right clicking on EIP on the right panel -> Modify value:
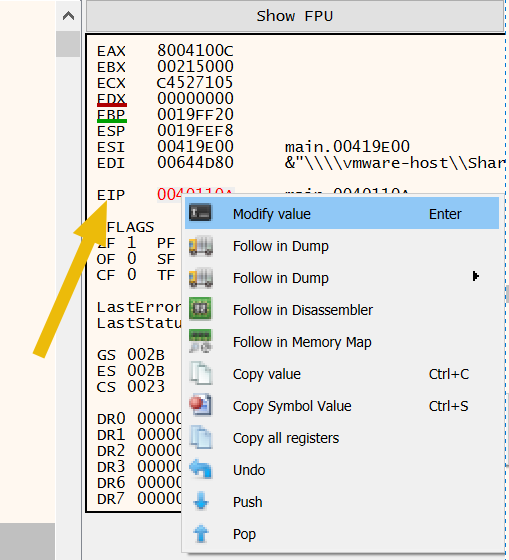
This let us to have our EIP location changed to the new address:

To finish, this is what we get after running with F9 (Run):
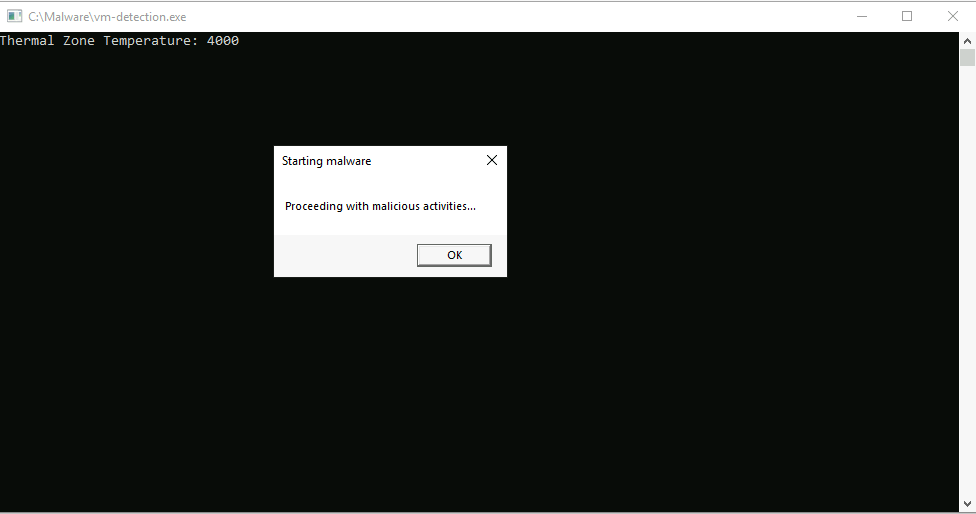
For the second one, we can to go after the checks where the MessageBox of the second type is done. To proceed with that, we might do a string search and go where the string “Proceeding with malicious activities…” is.
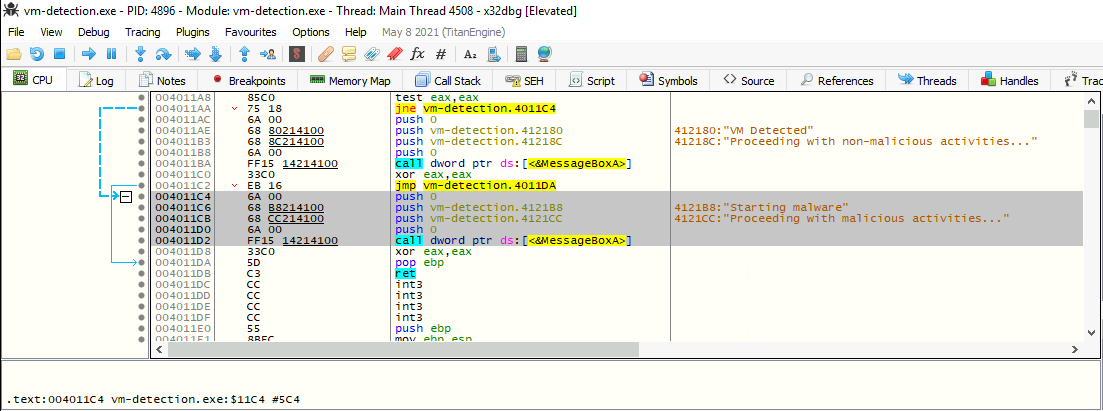
Then, we just need to modify the jump type and address to always jump to where the rogue part of the application is. To do that, we might use Space or Right click -> Assemble to change the operation from jne to jmp 0x004011C4.
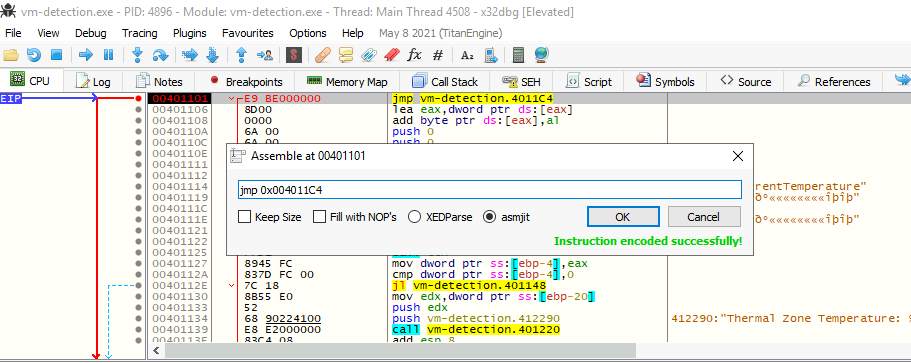
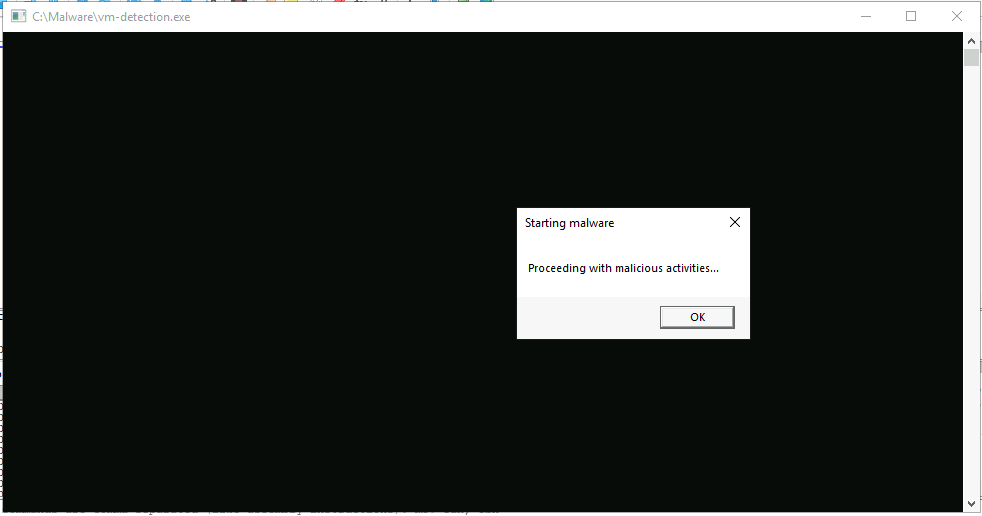
Finally, if we wanted to make this change permanent, we would have to patch as always using Ctrl+G.
Questions
In the C code snippet, what is the full WQL query used to get the temperature from the Win32_TemperatureProbe class?
Answer: SELECT * FROM MSAcpi_ThermalZoneTemperature
What register holds the memory address that tells the debugger what instruction to execute next?
Answer: EIP
Before uReturn is compared to zero, what is the memory location pointed to by [ebp-4]
Before uReturn is compared to 0, we toggle a breakpoint (004010FA) to see what is the value of EBP (0019FF20). Hence, we can substract this value by 4 (remember, it is in hex) or Ricght click on the operation -> Follow in Dump -> Address: EBP-4, then copy the highlighted memory address.
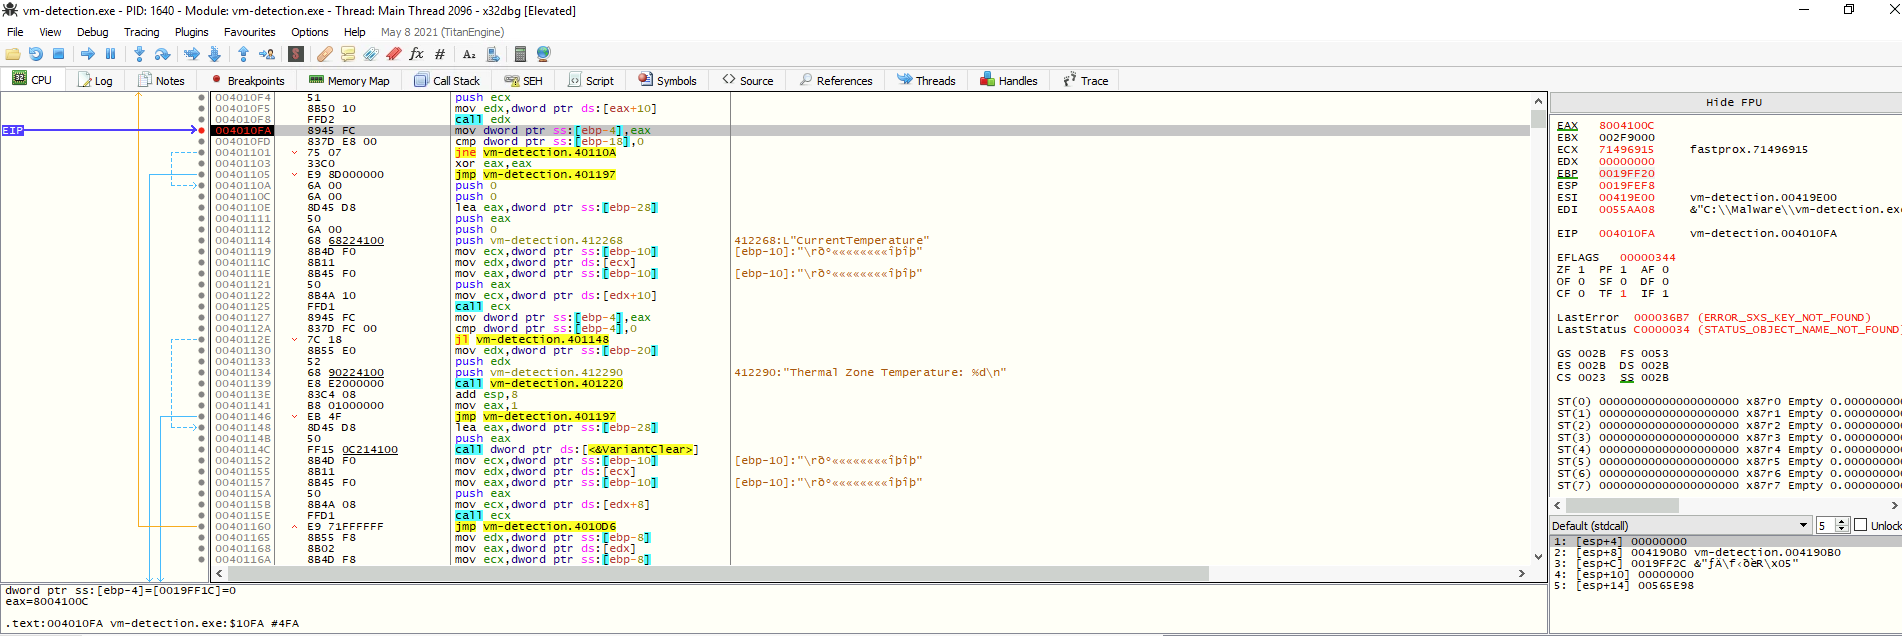
Answer: 0019FF1C
Task 6 - Packers (Overwiew)
Obfuscation is a technique that aims to intentionnaly obscure data and code to make it harder to understand or analyze.
The most common obfuscation techniques used by malware authors are:
- Encoding techniques: This involves encoding data like command line strings, domain names, IP addresses, etc… using encoding techniques such as
XORorBase64. - Encryption techniques: This involves encrypting data such as communications to a C2 server, files and network traffic using symmetric or asymmetric encryption.
- Code obfuscation: This involves various techniques such as manipulating the code to alter its syntax and structure, renaming functions or splitting code across multiple files or code segments.
Packers
Packers are tools that compress and encrypt executable files to embed them within a new executable file that serves as a wrapper or container. By dramatically reducing the file size, packers make it ideal for easy distribution and installation. Some of them include additionnal features such as code obfuscation, runtime packing and anti-debugging techniques. It is because of these features that packers are a tool of choice for malware authors.
There are a lot of packers available in the wild and each has a unique approach of packing. Here is a list of some popular:
It is essential to state that all packed programs are not malicious. packers can also be used for legitimate purposes such as protecting intellectual properties from theft. For example, Themida is known to be used in some video games.
Because packers encrypts and obfuscates a program, it would be impossible to know the malware’s capabilities without running it. This makes static analysis and signature-based detection unreliable. One of the information we could obtain form a packed sample is the packer tool used. Even though this announces to be tough, it can be a good starting point for an investigation.
Questions
What is the decoded string of the base64 encoded string “VGhpcyBpcyBhIEJBU0U2NCBlbmNvZGVkIHN0cmluZy4=”?
Answer: This is a BASE64 encoded string.
Task 7 - Identifying and Unpacking
The first stepdealing with packed malware is identifying the packer used. Using tools like Detect It Easy (DIE) and PEStudio, we can have a great starting point.
With DIE, we will try to identify the packer used for packed.exe, in order to try to unpack it.
Firstly, we start by opening it in DIE:
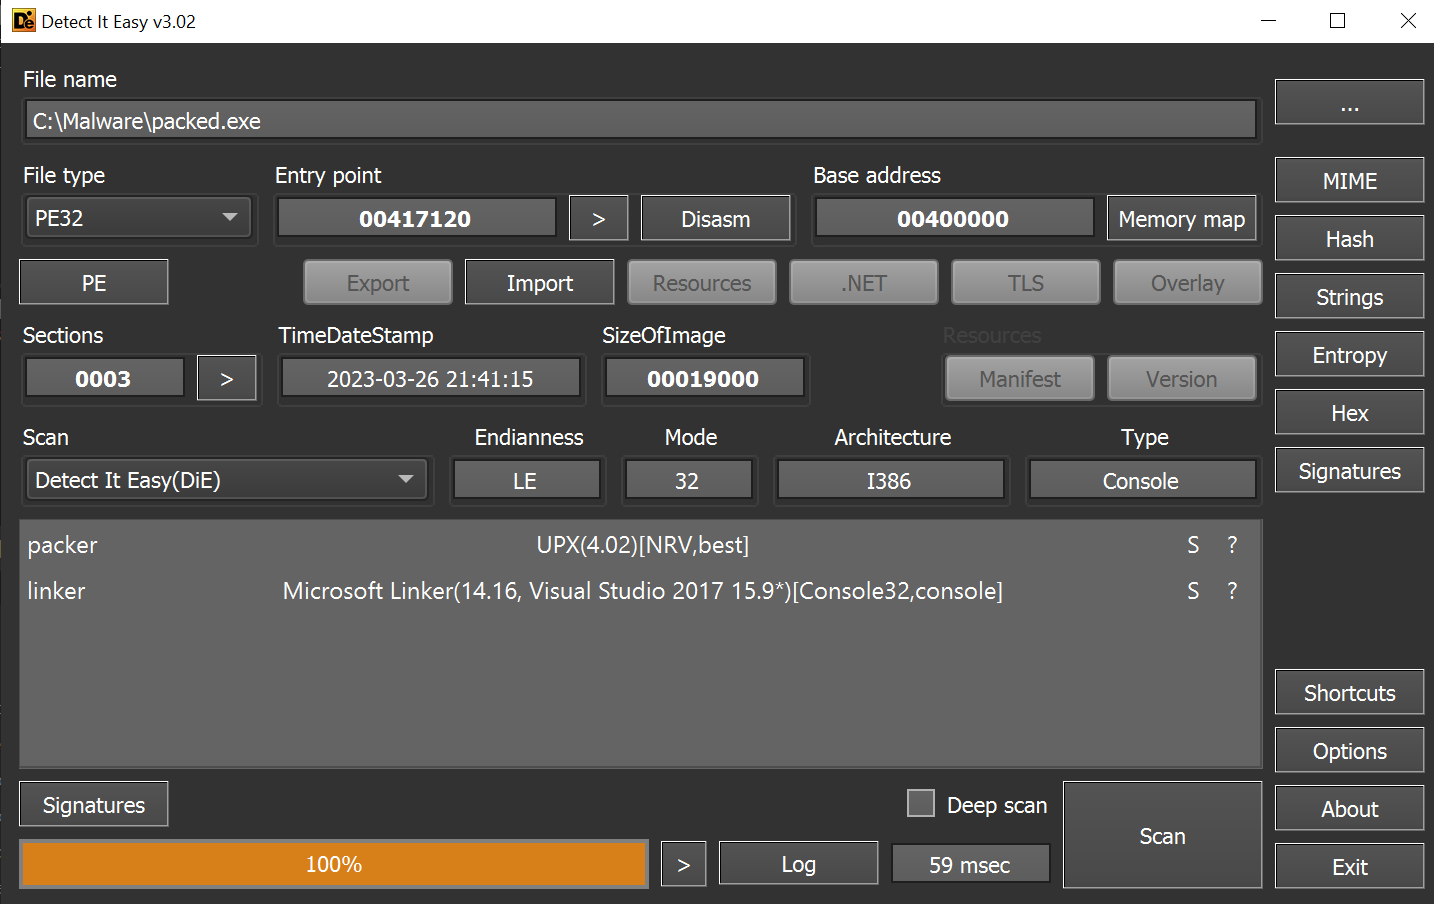
Detect It Easy displays its best guess if it can identify the packer. Here, it identifies the program as packed with UPX.
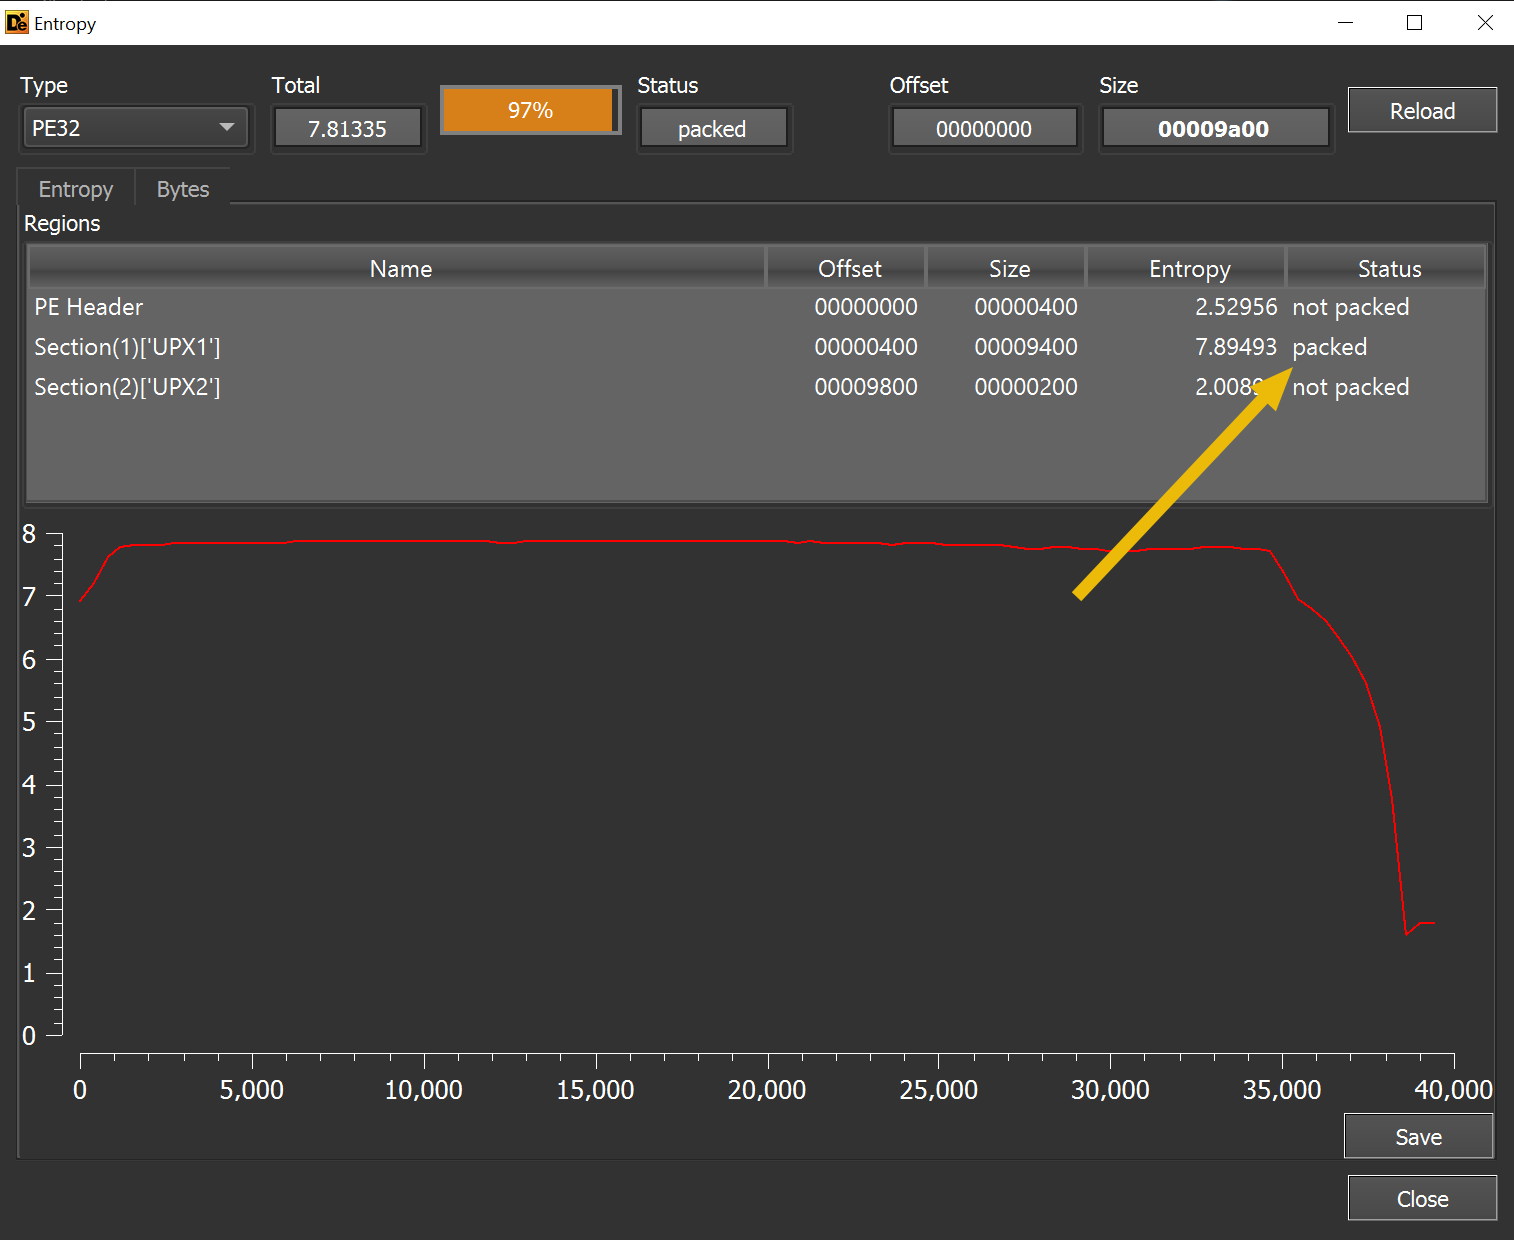
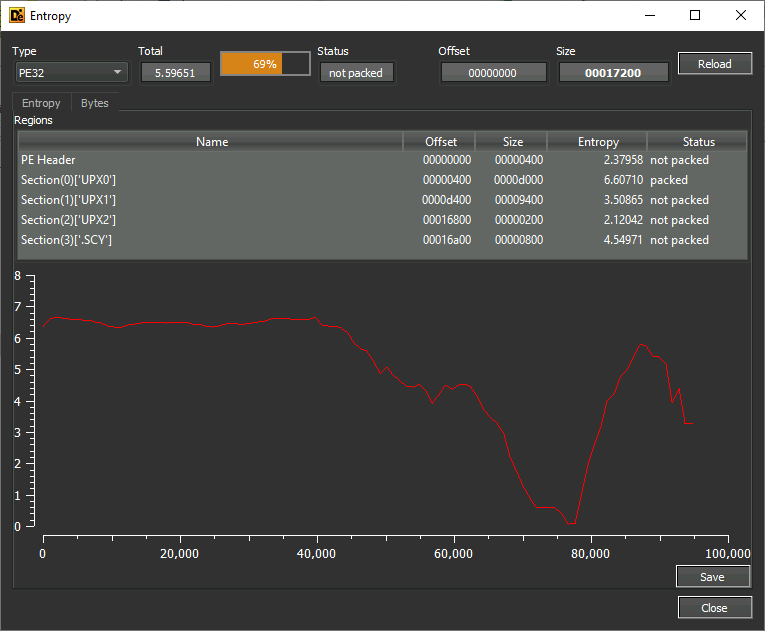
Also, we can check for the entropy with the Entropy button on the right panel. Because entropy is the measure of the randomness and a packer misplaces code blocks in a controlled way, we can identify if a binary is packed or not. The Entropy window determines how much entropy each section (normally .text, .data, .rsrc…) has. In this PE, the sections names are changed because of packing and they are renamed UPX1 and UPX2. The second is not packed because it contains the code to unpack the first one, which is packed.
Another tool is PEStudio, which lists information on PE files. With it, we can also check for sections in sections (self-modifying) and get more information than with DIE.
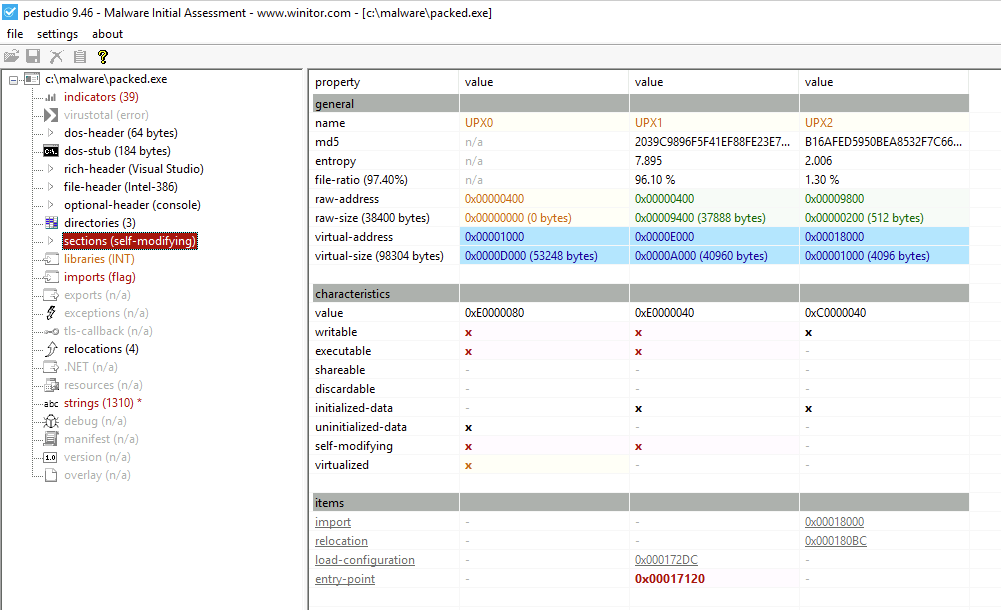
Like we have seen before, we also see that the section names was modified. Although this is the most identifiable piece of information tht packers can leave, not every one change these values.
Automated Unpacking
Once the packer is identified, it is possible to use an unpacker to get back to the original file. Some are readily available, like in the case of UPX. However, for other commercial tools like Themida, we may have to rely on 3rd party tools.
Here are some scripts to try unpacking packed binaries with specific tools:
With a malware packed with a more obscure packer, it might be tougher. Even though, trying to upload it to unpac.me might result with an unpakced executable.
Manual Unpacking and Dumping
Ultimately, the best way to unravel malware is by executing it.
When executed, the container code performs decryption and deobfuscation. Once fully unpacked, the malware can proceed with its own code and we can thoroughly analyze it while it is in memory with a debugger.
On the provided VM, we will analyze packed.exe.
Firstly, we will open the program with F3 and we will run it once with F9. We should arrive at a default breakpoint, the EntryPoint one. Obviously, this is the entry point for the unpack code and not the real one.
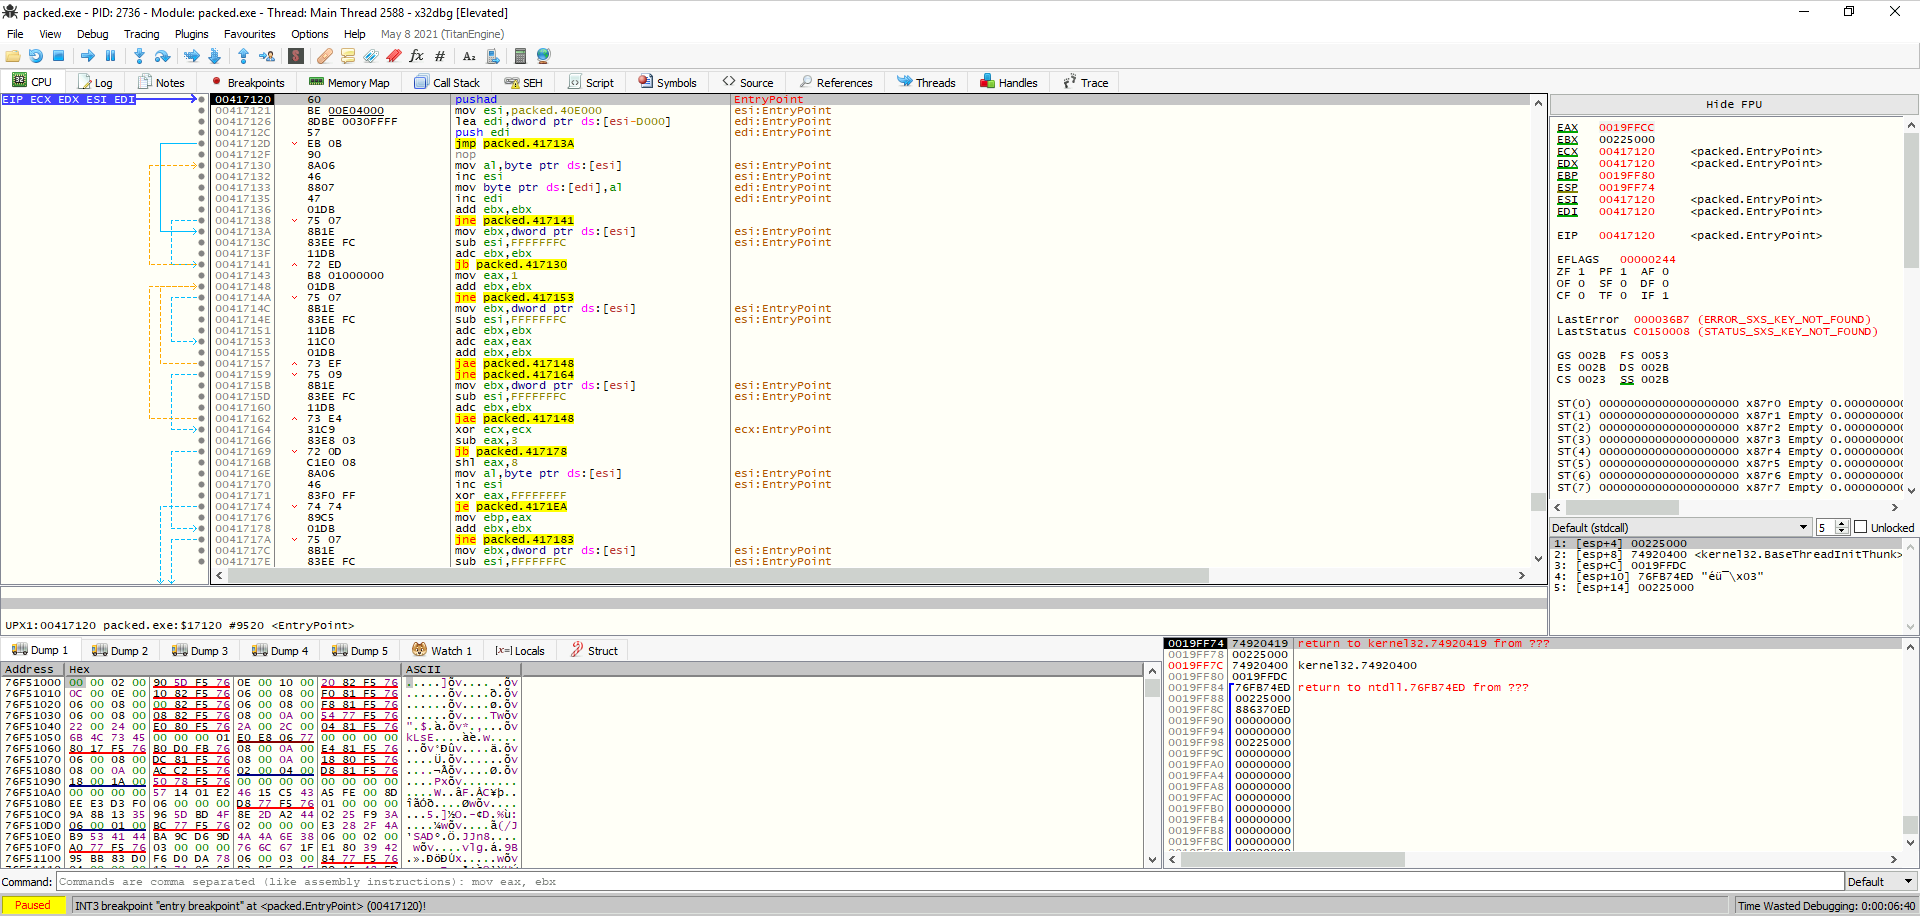
Following the process, we could continue to press F8 (Step Over) to see what is going one. However, if we watch a bit further on the code disassembly, we can see a interesting part which could correspond at the end of the unpacking program. This is because after this, we jump at an address where a normal program content is located and there are a few instructions repeating. We press F2 to put a breakpoint on the jmp opcode at the address 004172D4 and press F9 to go there.
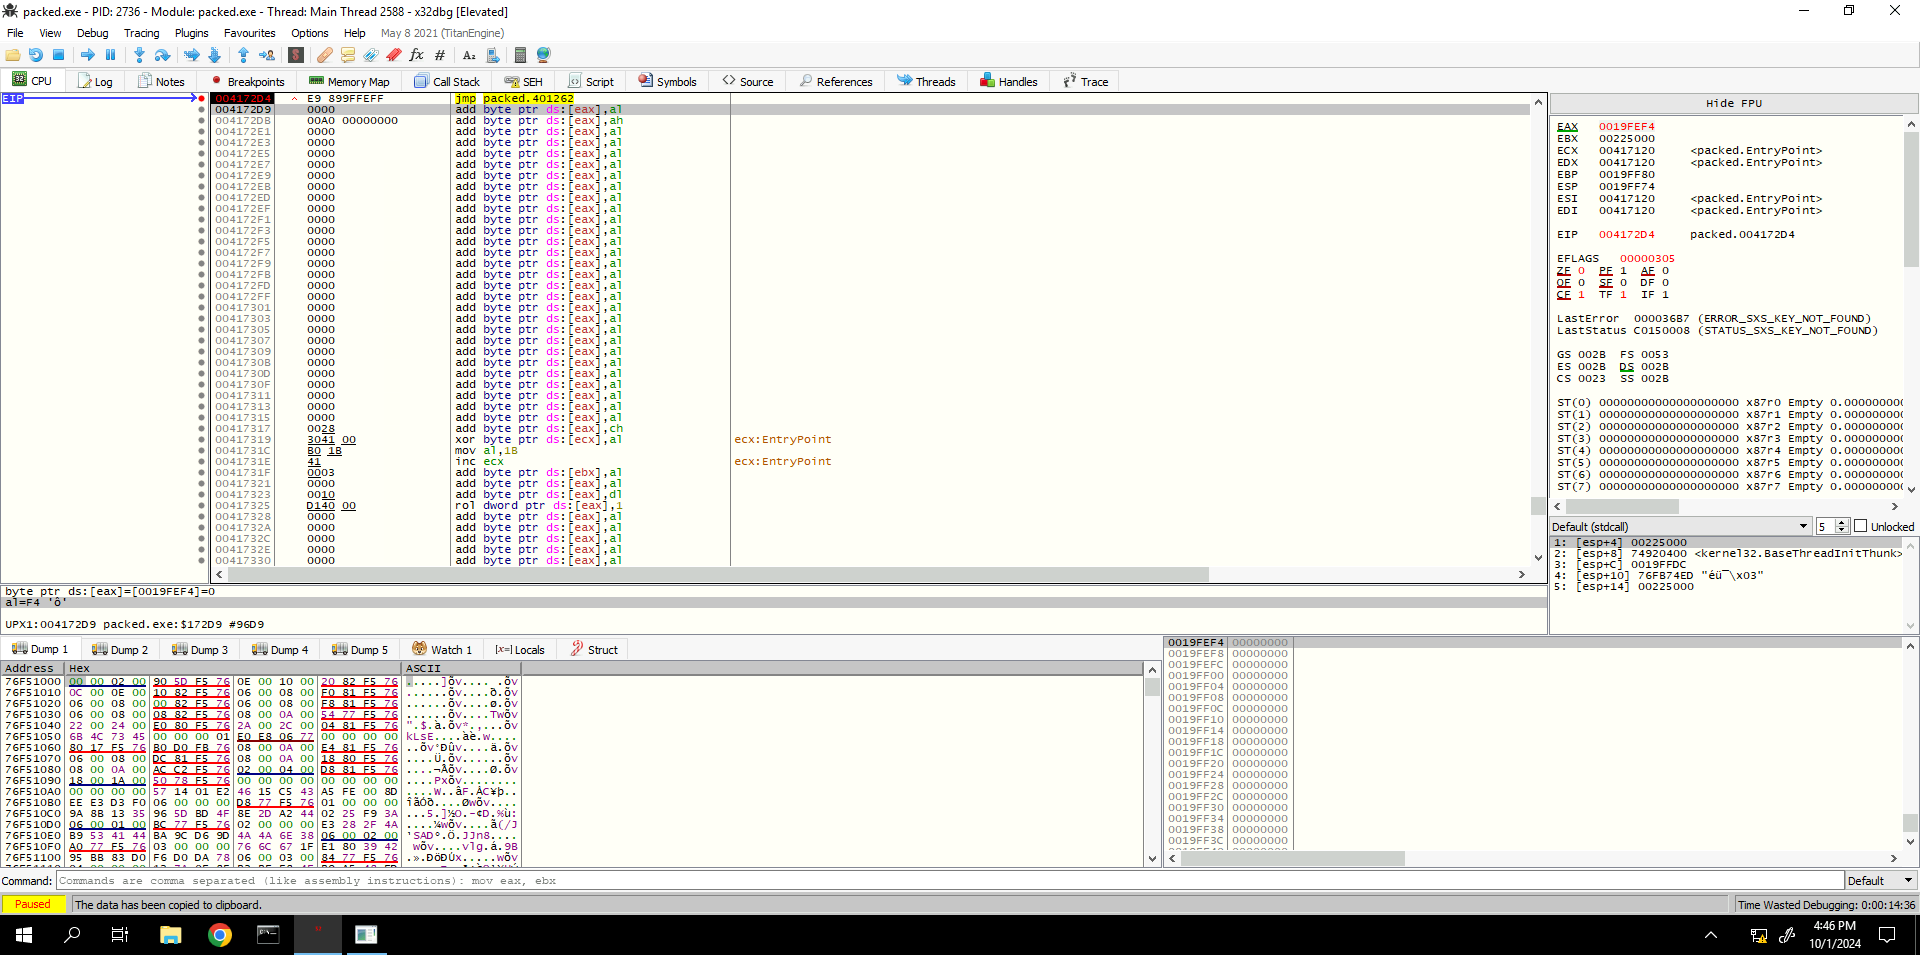
For relevance, when UPX-malware is being unpacked, 004172D4 address location tells to UPX that malware have been successfully unpacked and the legitimate part of the program resides at 00401262.
Note: This unpacking approach and memory locations differs from a packer to another.
With the Scylla plugin, we can dump the unpacked legitimate part of the program to memory and fix it so it will have the updated memory locations from its DLL imports. Scylla is a tool that can dump process memory to disk and fix and rebuild the Import Address Table (IAT).
To open it, we go to Plugins -> Scylla on the top menu bar. Please note that he OEP (Original Entry Point) is the address of where the legitimate part of the program starts. Once the window is opened, we click on Dump and save the file somewhere.
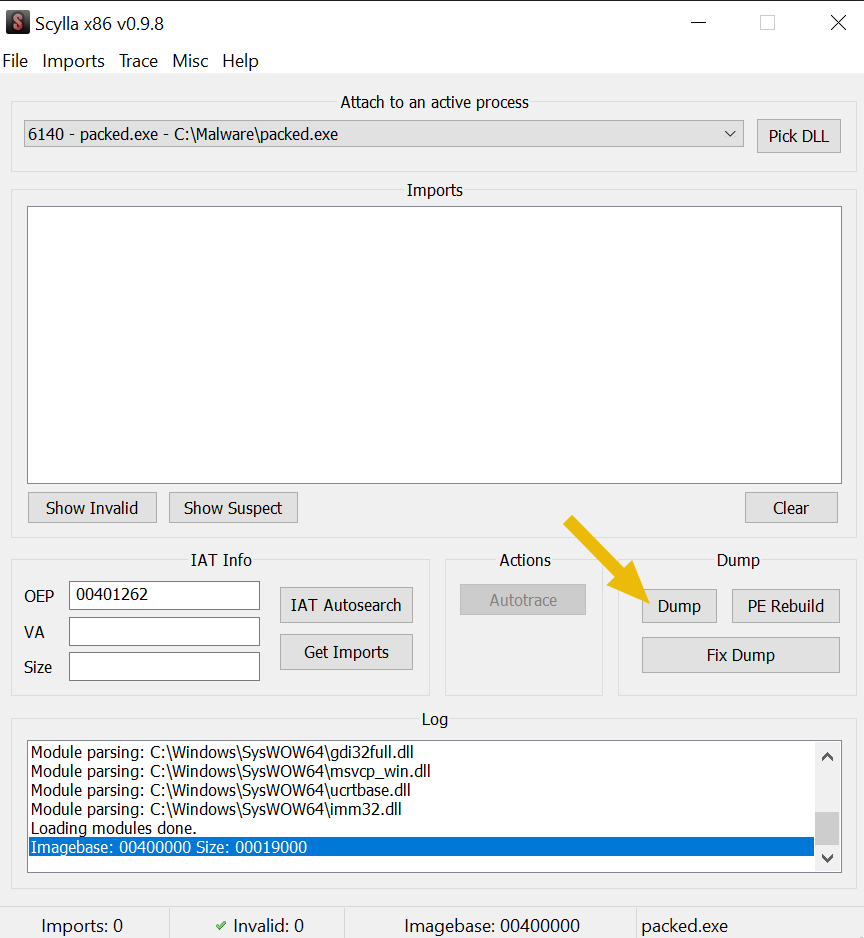
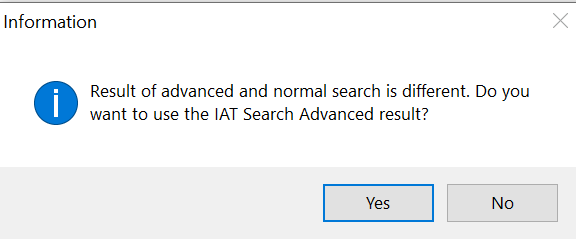
Once this is done, we click on IAT Autosearch to search the original IAT loaded in the program’s memory. A pop-up asks to use Advanced IAT Search or no. Hence we click on no and OK to use the standard method.
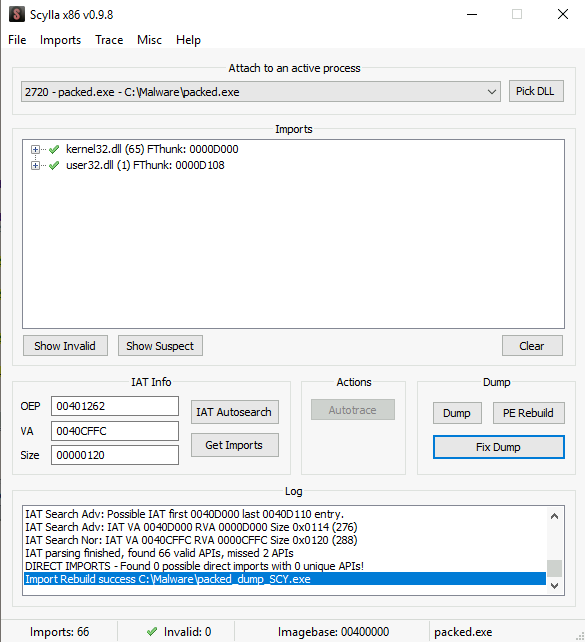
At this point, we can now click on Get Imports button to update the Import list section. This list shows us all DLLs used by the program. Sometimes, invalid entries marked with an “X” are found by Scylla. These are safe to delete because the list already covers all the DLLs. To delete these, we Right click -> Cut thunk on each invalid row.
When we are left only with valid values, we click on Fix Dump and select the previously generated file. With the string “_SCY” appended to the name, the program now work correctly.
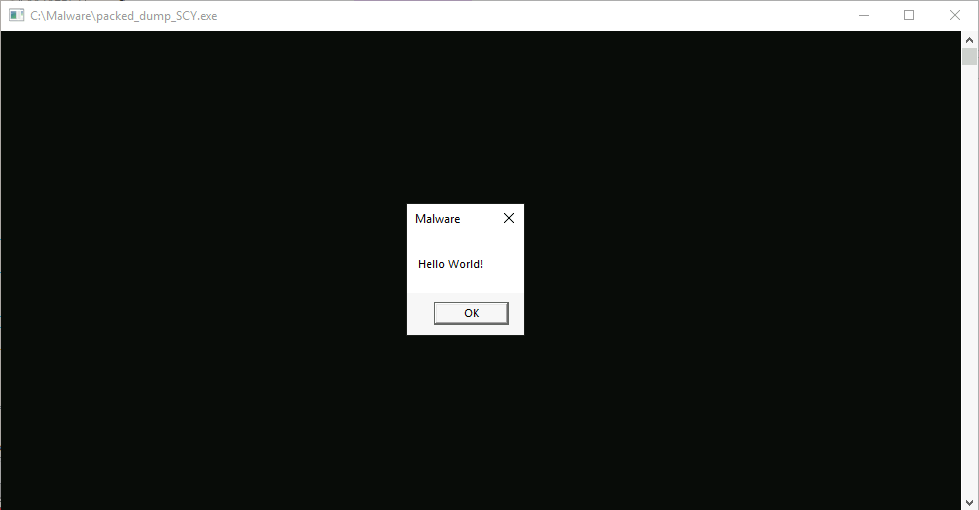
We can confirm the successful unpacking with DIE or PEStudio, which does not detect our binary as Packed anymore:
Questions
For these questions, we just need to open packed.exe in DIE or PEStudio.
According to DetectItEasy, what is the version of the Microsoft Linker used for linking packed.exe?
Answer: 14.16
According to pestudio, what is the entropy of the UPX2 section of packed.exe?
Answer: 2.006
Task 8 - Conclusion
In this room, we explored the various anti-reverse engineering techniques that malware authors employ to complicate the analysis of their malicious software. We discussed the motivations behind these techniques, such as preventing debugging through methods like checking for debuggers, VM detection, tampering with debug registers, and using self-modifying code. We also examined practical applications, such as the use of the Windows API function SuspendThread to pause execution and hinder debugging efforts. Additionally, we learned how to circumvent these protections through patching and manipulation techniques, which included directly altering memory values and using the EIP register to control execution flow.
While this session provided valuable insights into the realm of anti-reverse engineering, it’s important to recognize that the field is vast and continually evolving and this room helped us to delve into the surface of it.
Enjoy Reading This Article?
Here are some more articles you might like to read next: