THM Advanced Static Analysis
Task 1 - Introduction
Unlike in Basic Static Analysis where we looked more at the characteristics of malware, like strings, hashes, import functions, and other key information; in Advanced Static Analysis, we will dig further by analyzing disassembled code and the associated assembly instructions.
Advanced static analysis is a technique used to analyze the code and structure of malware without executing it, in order to identify the malware’s behavior and weaknesses.
Learning Objectives
Some of the topics that are covered in this room are:
- Understand how advanced static analysis is performed.
- Exploring Ghidra’s disassembler functionality.
- Understanding and identifying different C constructs in assembly.
Task 2 - Malware Analysis - Overview
To begin with, malware analysis is the fact of examining malicious software (malware) to understand how it works and identify its capabilities, behavior and potential impact. There are four main steps in analyzing malware:
- Basic static analsis
- Basic dynamic analysis
- Advanced static analysis
- Advances dynamic analysis
Each step uses different tools and techniques to gather information about the malware.
Static Analysis
Static analysis aims to understand the malware’s structure and behavior without executing it. Basic analysis involves examining the malware’s code, file headers and other simple static properties. Advanced analysis, on the other hand, aims to uncover hidden or obfuscated code and functionality within the malware. This involves more advanced techniques to analze the malware’s code, such as deobfuscation and code emulation.
Dynamic Analysis
Dynamic analysis aims to observe the malware’s behavior during execution in a controlled environment. Basic analysis involves executing the malware in a sandbox or virtual machine and monitoring its system activity, network traffic and process behavior. Advanced analysis seeks to uncover more complex and evasive malware behiavor using advanced monitoring techniques with more sophisticated sandboxed and monitoring tools to capture it in greater detail.
How Advanced Static Analysis is Performed ?
Advanced static analysis is a crucial process for understanding its behavior and identifying its potential threats. The key objectives are to discover the malware’s capabilities, identify its attack vectors and determine the evasion techniques.
To perform this type of analysis, dissasemblers such as IDA Pro, Binary ninja and radare2 are commonly used. These disassemblers allow the analyst to explore the malware’s assembly code/pseudo-c code and identify the functions and data structures.
The steps involved are as follows:
- Identify the entry point of the malware and the system calls it makes.
- Identify the malware’s code sections and analyze them using available tools such as debuggers and hex editors.
- Analyze the malware’s control flow graph to identify its execution path.
- Trace the malware’s dynamic behavior by analyzing the system calls it makes during execution.
- Use the above information to understand the malware’s evasion techniques and the potential damage it can cause.
Questions
Does advanced static analysis require executing the malware in a controlled environment? (yay/nay)
Answer: nay
Task 4 - Ghidra: A Quick Overview
Many disassemblers like cutter, ghidra, radare2 ans IDA Pro can be used to disassemble any type of program. However, we will explore Ghidra because it’s free, open-source and has many features that can be utilized to get proficient in reverse engineering. The objective is to get comfortable with the main usage of a disassembler and use that knowledge to any others.
Ghidra includes many features that make it a powerful reverse engineering tool. Some of these features include:
- Decompilation: Ghidra can decompile binaries into readable C code, making it easier for developers to understand how the software works.
- Disassembly: Ghidra can disassemble binaries into assembly language, allowing analysts to examine the low-level operations of the code.
- Debugging: Ghidra has a built-in debugger that allows users to step through code and examine its behavior.
- Analysis: Ghidra can automatically identify functions, variables, and other code to help users understand the structure of the code.
How to use Ghidra for Analysis
Here, we will explore Ghidra and its features by analyzing the HelloWorld.exe sample.
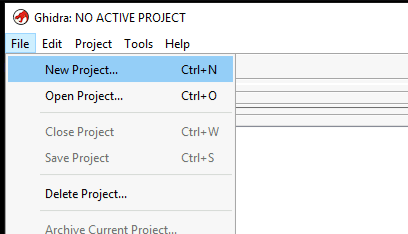
To begin with, open Ghidra and create a new project
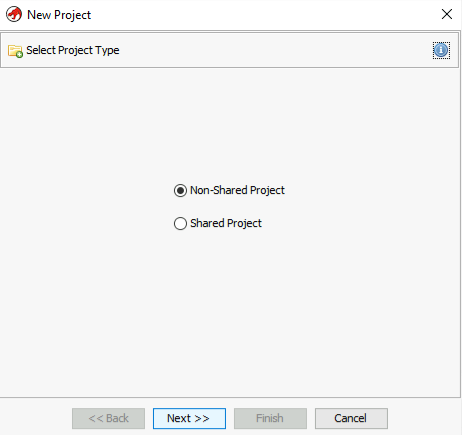
Secondly, select Non-Shared Project. Shared Project is to allow us to share our analysis with other analysts.
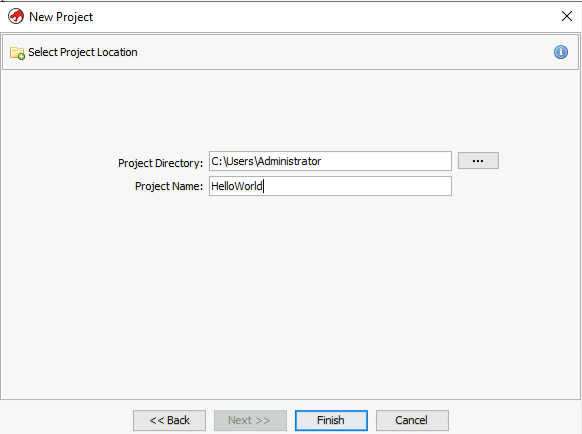
Then, name the project accordingly to our binary.
When the window Active Project is shown, drag and drop HelloWorld.exe or File -> Import File to begin the program’s analysis.
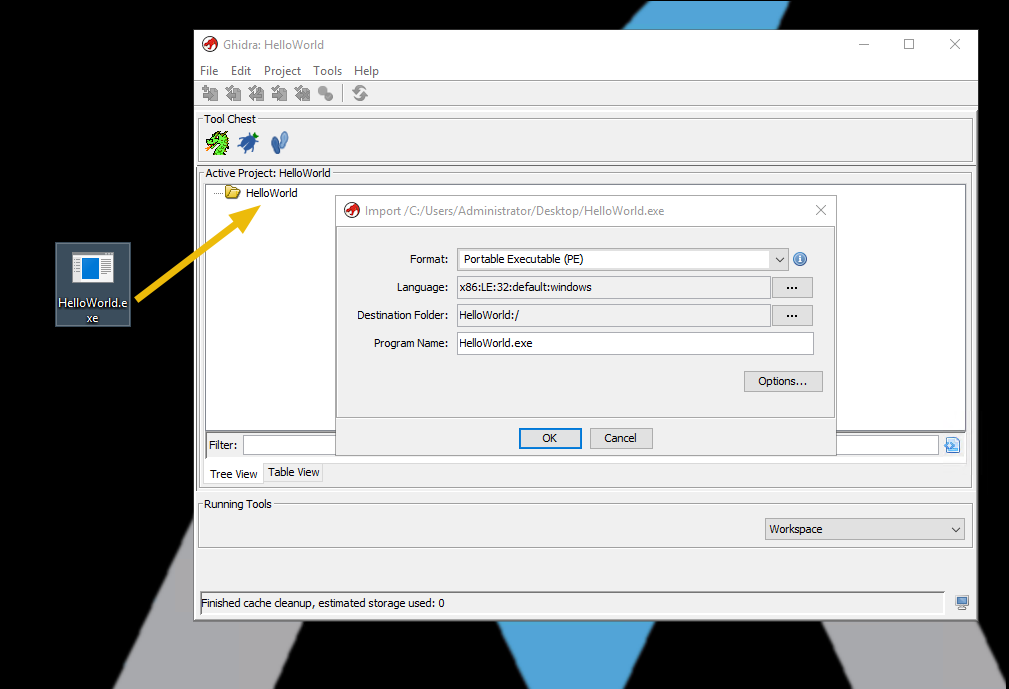
Once it is imported, we get the program’s summary as shown below:
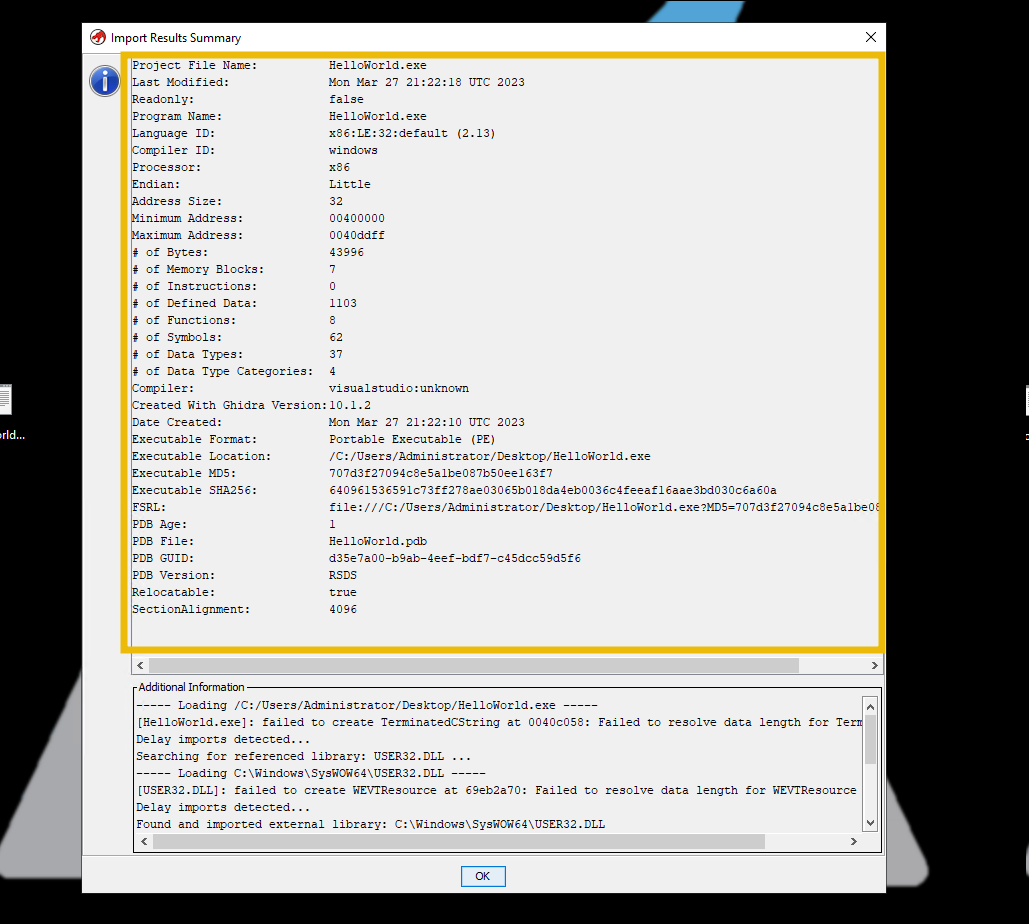
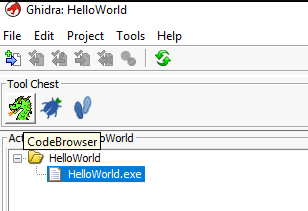
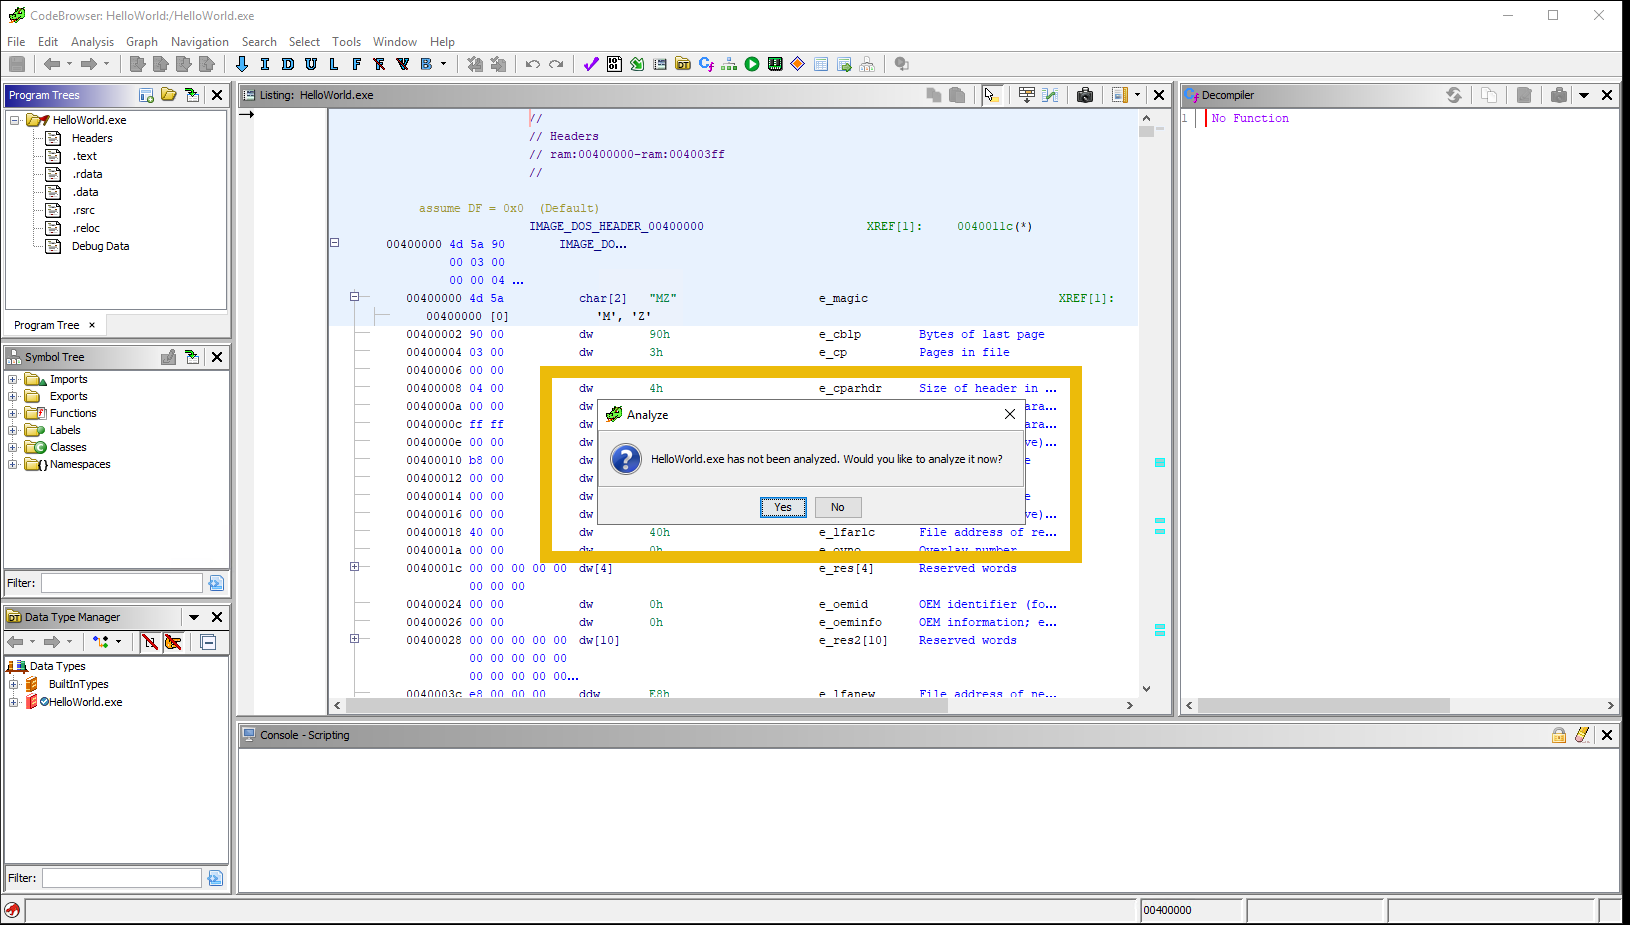
After that, double-click on HelloWorld.exe or click on the dragon icon to open the CodeBrowser and re-import the file. When asked to analyze the executable, click on Yes.
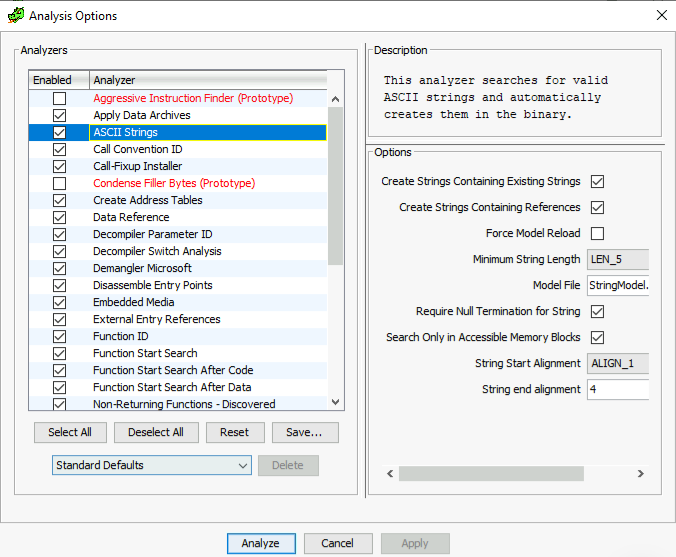
The next window that appears show us various analysis option. We can check or uncheck them based on our needs. These add-ons assist Ghidra during analysis.
It will take some time to analyze. The bottom bar show the current progress.
Exploring the Ghidra Layout
Ghidra has so many options to aid in our analysis. The default layout is shown and explained briefly below.
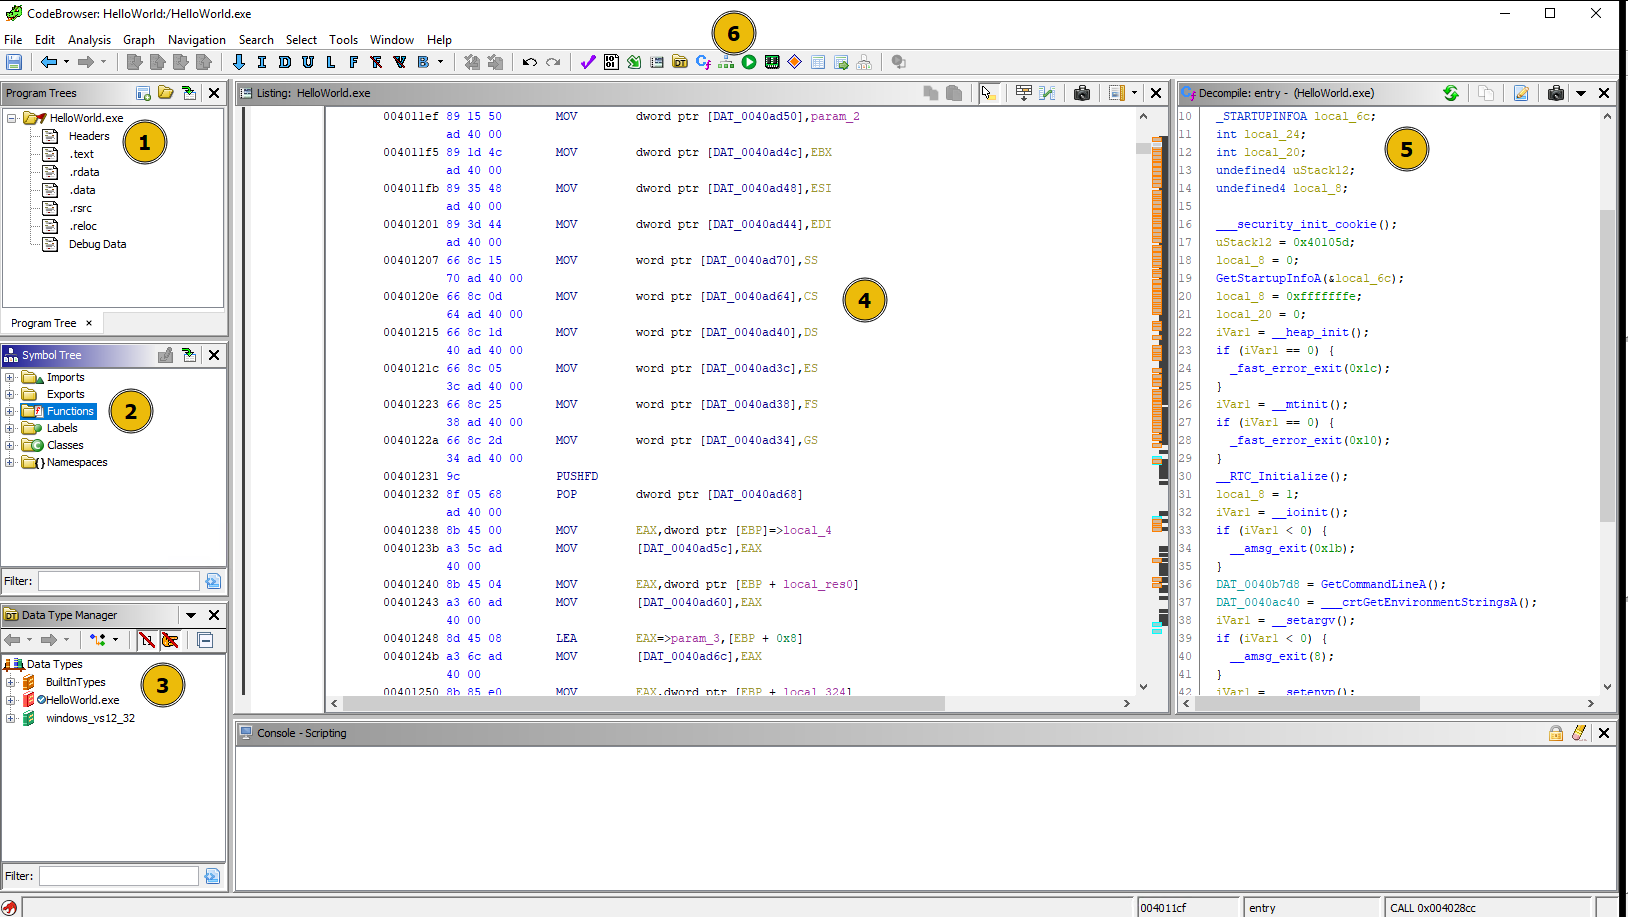
- Program Trees: Show the sections of the program. We can click on different sections to see the content within each. The Dissecting PE Headers room explain headers and PE Sections in depth.
- Symbol Tree: Contains important sections like Imports, Exports and Functions. Each seciton provides a wealth of information about the program we are analyzing.
- Imports: This section contains information about the libraries being imported by te program. Clicking on each API call shows the assembly code that uses that API.
- Exports: This section contains the API/function calls being exported by the program. This section is useful when analyzing a DLL, as it will show all the functions it contains.
- Functions: This section contains the functions it finds within the code. Clicking on each function will take us to the disassembled code of that function. It also contains the entry function. Clicking on the entry function will take us to the start of the program we are analyzing. Functions with generic names starting with
FUN_VirtualAddressare the ones that Gidra does not give any names to.
- Data Type Manager: This section shows various data types found in the program.
- Listing: This window show the dissassembled code of the binary, which included the following values in order:
- Virtual Address
- Opcode
- Assembly Instrcution (PUSH, POP, ADD, XOR, etc…)
- Operands
- Comments
- Decompile: Ghidra translates the assembly code into a pseudo C code here. This is a very important section to look at during analysis as it gives a better understanding of the assembly code.
- Toolbar: Various options to use during the analysis.
- Graph View: The Graph View in the toolbar is an important option, allowing us to see the graph view of the disassembly.
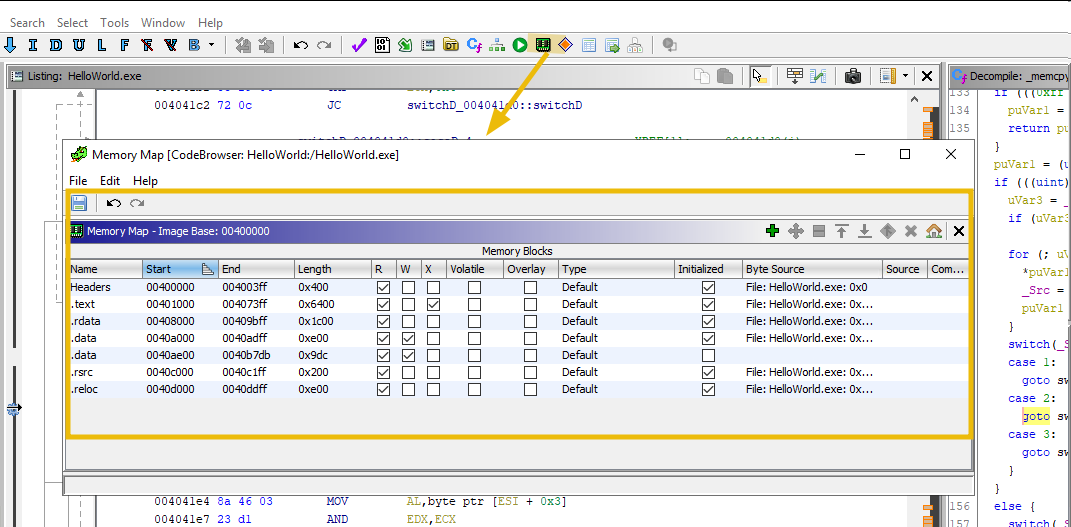
- The Memory Map option shows the memory mapping of the program as shown below:
- This navigation toolbar shows different options to navigate through the code.

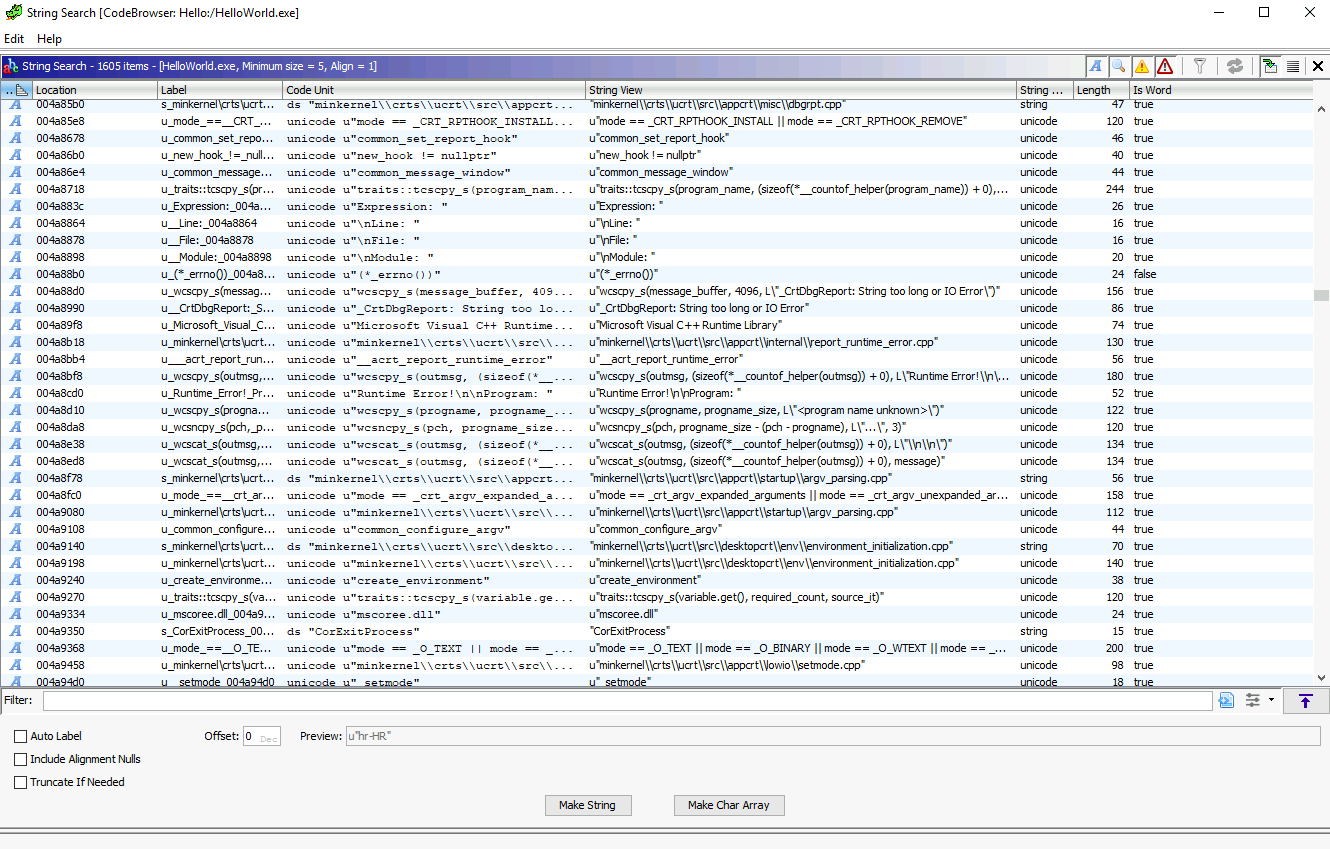
- To explore strings, go to
Search -> For Stringsand click Search will give us the strings that Ghidra finds withing the binary. This window can contain important information to help us.
Analyzing HelloWorld in Assembly
There are many ways to reach the code of interest. To find the assembly code for HelloWorld.exe, we will go for a String Search to see where is our string Hello World.
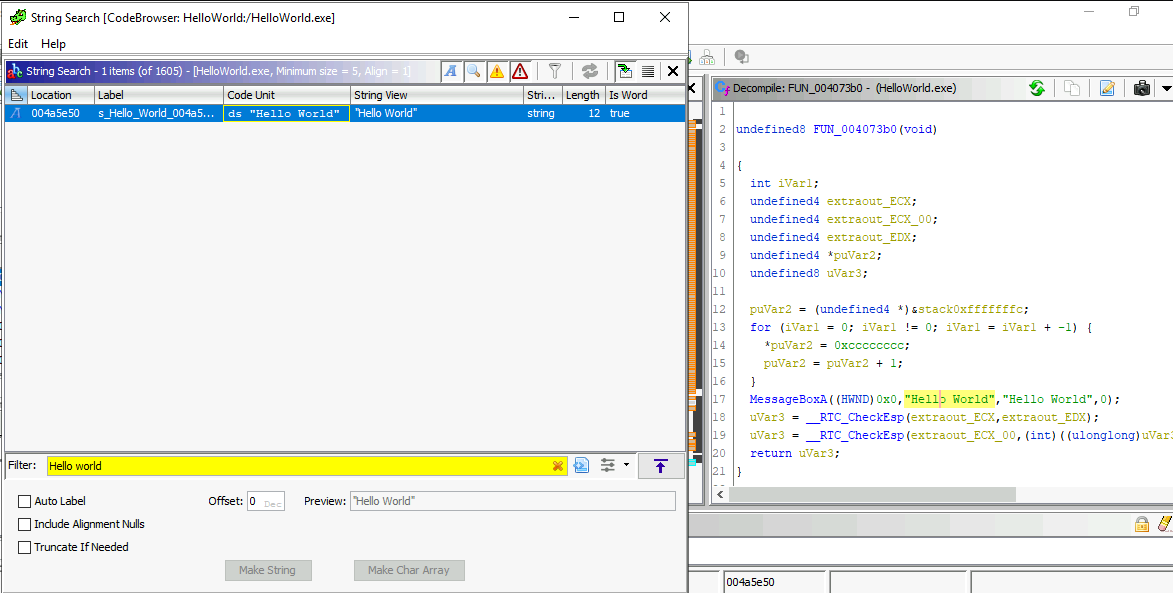
The search has returned the code block of the MessageBox call using the Hello World string. We may notice that the main function is filled with compiler things.
We explored Ghidra and its features in this task by examining a simple “HelloWorld” program. In the next task, we will use this knowledge to explore different C constructs and their corresponding representations in assembly.
Note: It is trivial to note that the malware’s author may have packed it or used obfuscation or Anti VM / AV detection techniques to make the analysis harder. These techniques will be discussed in the coming rooms.
Questions
How many function calls are present in the Exports section?
The only exported function is called entry. However, this is not our main function like depicted above.
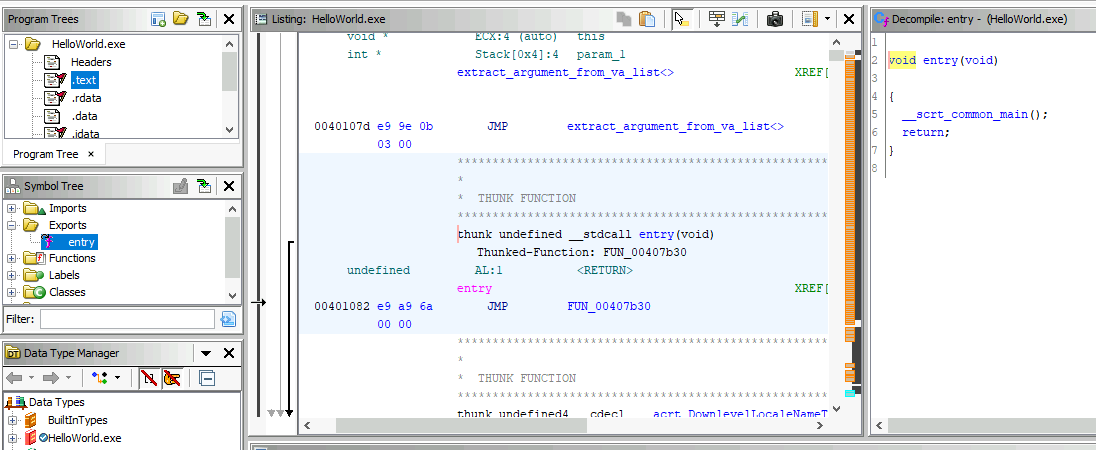
Answer: 1
What is the only API call found in the User32.dll under the Imports section?
The only API call for User32.dll is the MessageBoxA function.
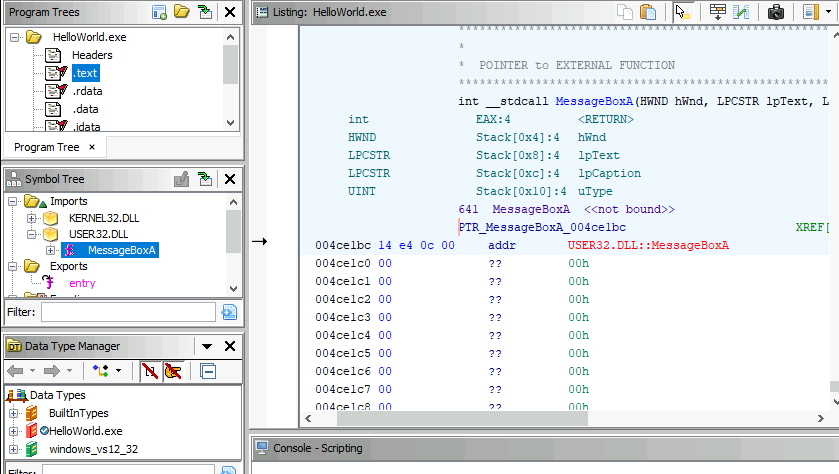
Answer: MessageBoxA
How many times can the “Hello World” string be found with the Search for Strings utility?
Like shown before, the Hello World string is only found one time in the Search -> For Strings menu.
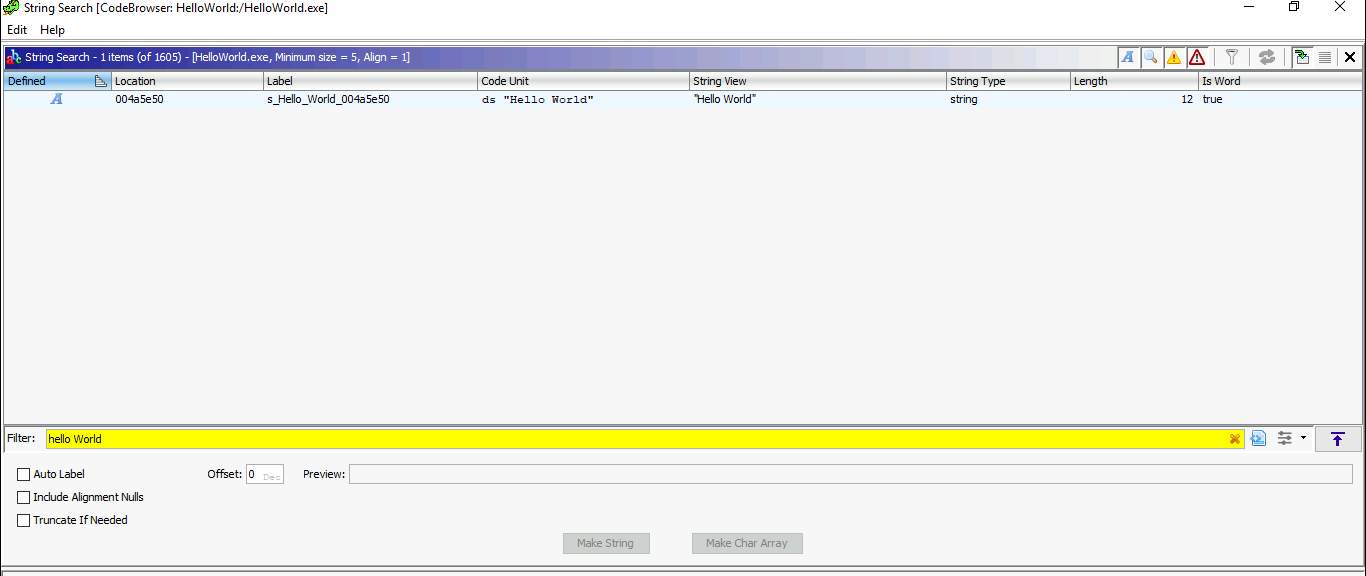
Answer: 1
What is the virtual address of the CALL function that displays “Hello World” in a messagebox?
By double-clicking on the Code Unit case of the string search, we can go to the location of the string Hello World.

Once that is done, double-clicking on the parent function (XREF), we are welcomed with the disassembly of the main function, containing MessageBoxA.
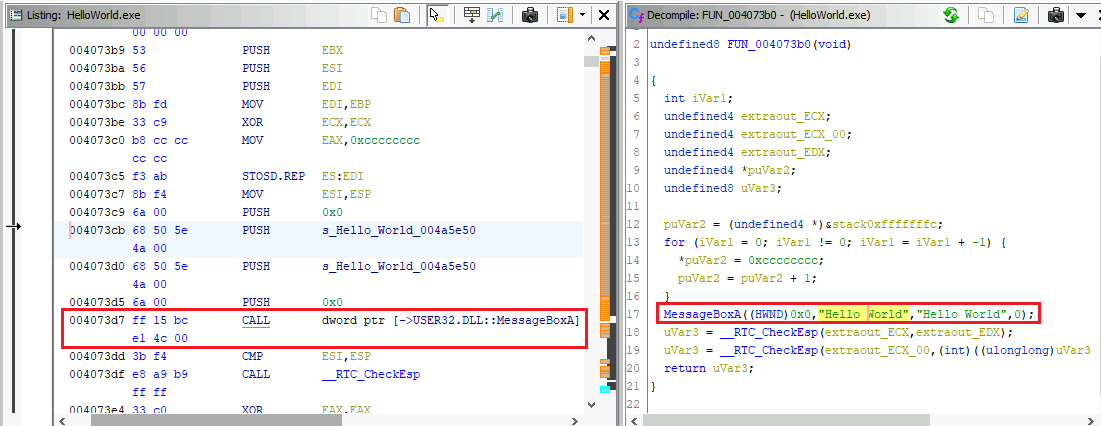
Answer: 004073d7
Task 5 - Identifying C Code Constructs in Assembly
Analyzing assembly code of compiled binaries can be overwhelming for beginners. That is why understanding assembly instructions and how various programming components are translated into assembly is important.
We are loading components of the Code_Constructs into Ghidra.
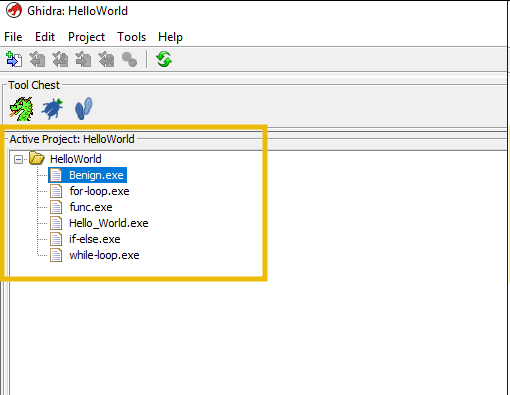
There are different approaches to begin analyzing the code:
- Locate the main function from the Symbol Tree section.
- Check the .text code from the Program Trees section to see the ode section and find the entry point.
- Search for interesting strings and locate the code from where those are referenced.
Note: Different compilers add their own code for various checks while compiling. Therefore expect some garbage assembly code that does not make sense.
Code: Hello World
In C language
The Hello World program is one of the most basic program to try out a new language.
#include <stdio.h>

int main {
    printf("Hello World\n");
    return 0;
}
In Assembly
section .data
    message db 'HELLO WORLD!!', 0 ; Defines the string "HELLO WORLD!!" followed by a null byte in memory

section .text
    global _start

_start:
    ; write the message to stdout
    mov eax, 4      ; write system call
    mov ebx, 1      ; file descriptor for stdout
    mov ecx, message    ; pointer to message
    mov edx, 13     ; message length
    int 0x80        ; call kernel
This program defines a string “HELLO WORLD!!” in the .data section and then uses the write system call to print the string to stdout.
In Ghidra
The Hello World code can be found by doing a string search.
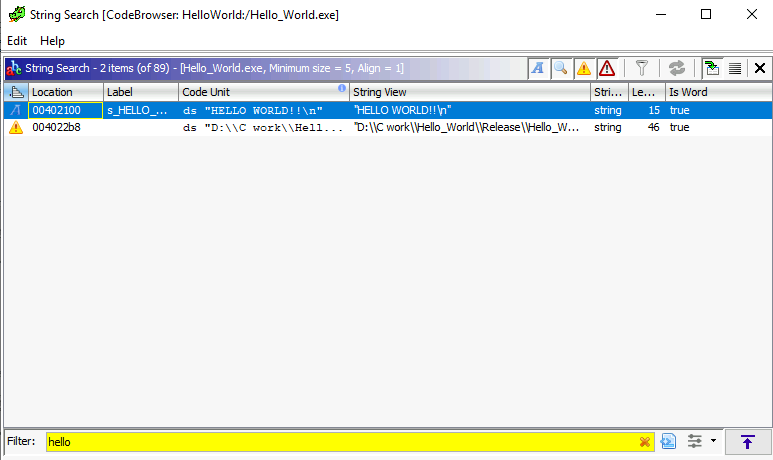


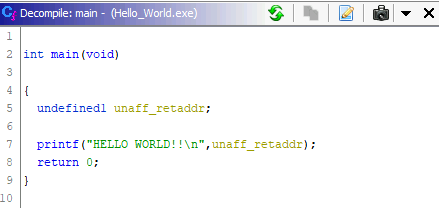
We know that function is the main function, hence we can rename our function on the decompiler section.
Code: For Loop
In C Language
A For loop permit to repeat certain instructions until it completes.
int main() {
    int i;
    for (i=0; i<5; i++) {
        std::cout << i << std::endl;
    }
    return 0;
}
In Assembly
main:
    ; initialize loop counter to 0
    mov ecx, 0

    ; loop 5 times
    mov edx, 5
loop:
    ; print the loop counter
    push ecx
    push format
    call printf
    add esp, 8

    ; increment loop counter
    inc ecx

    ; check if the loop is finished
    cmp ecx, edx
    jl loop
In Ghidra
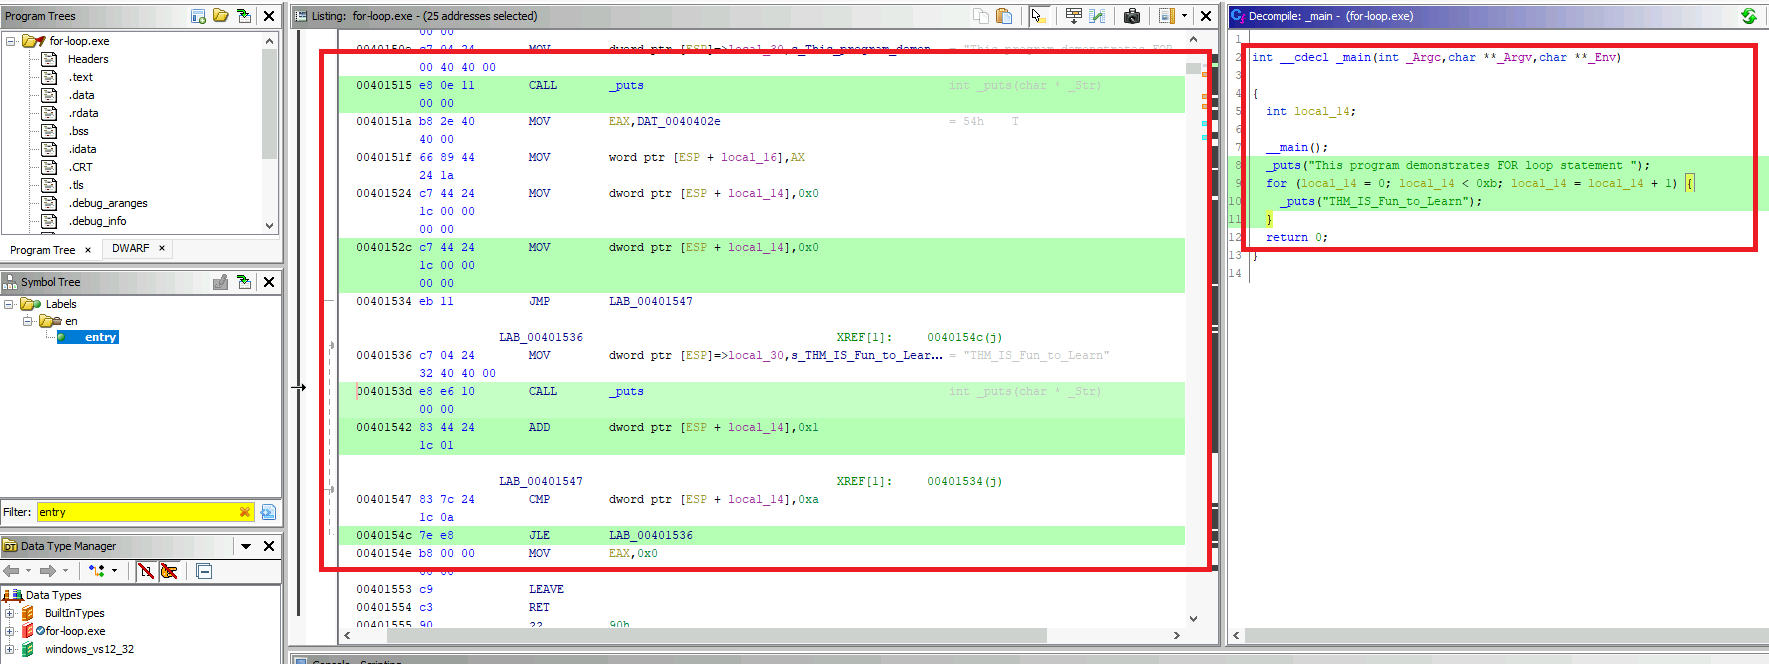
The for-loop.exe is the program which contains the loop code.
This is its behaviour:
PS C:\Users\Administrator\Desktop\Code_Constructs> .\for-loop.exe
This program demonstrates FOR loop statement
THM_IS_Fun_to_Learn
THM_IS_Fun_to_Learn
THM_IS_Fun_to_Learn
THM_IS_Fun_to_Learn
THM_IS_Fun_to_Learn
THM_IS_Fun_to_Learn
THM_IS_Fun_to_Learn
THM_IS_Fun_to_Learn
THM_IS_Fun_to_Learn
THM_IS_Fun_to_Learn
THM_IS_Fun_to_Learn
On Ghidra, we can get the main function a bit after the entry point. Moreover, we get the decompiled pseudo-C code of the for loop.
Code: Function
In C Language
int add(int a, int b){
    int result = a + b;
    return result;
}
In Assembly
add:
    push ebp          ; save the current base pointer value
    mov ebp, esp      ; set base pointer to current stack pointer value
    mov eax, dword ptr [ebp+8]  ; move the value of 'a' into the eax register
    add eax, dword ptr [ebp+12] ; add the value of 'b' to the eax register
    mov dword ptr [ebp-4], eax  ; move the sum into the 'result' variable
    mov eax, dword ptr [ebp-4]  ; move the value of 'result' into the eax register
    pop ebp           ; restore the previous base pointer value
    ret               ; return to calling function
The add function starts by saving the current base pointer value onto the stack. Then, it sets the base pointer to the current stack pointer value. The function then moves the values of a and b into the eax register, adds them, and store the result in the result variable. Finally, the function moves the value of the result into the eax register, restores the previous base pointer value, and returns to the calling function.
Code: While loop
In C Language
int i = 0;
while (i < 10) {
    printf("%d\n", i);
}
In Assembly
mov ecx, 0     ; initialize i to 0
loop_start:
cmp ecx, 10    ; compare i to 10
jge loop_end   ; jump to loop_end if i >= 10
push ecx       ; save the value of i on the stack
push format    ; push the format string for printf
push dword [ecx]; push the value of i for printf
call printf    ; call printf to print the value of i
add esp, 12    ; clean up the stack
inc ecx        ; increment i
jmp loop_start ; jump back to the start of the loop
loop_end:
In Ghidra
Using the provided program, Ghidra seems to interpret the while loop as a for loop one. This is maybe due also on how has compiled the source code.
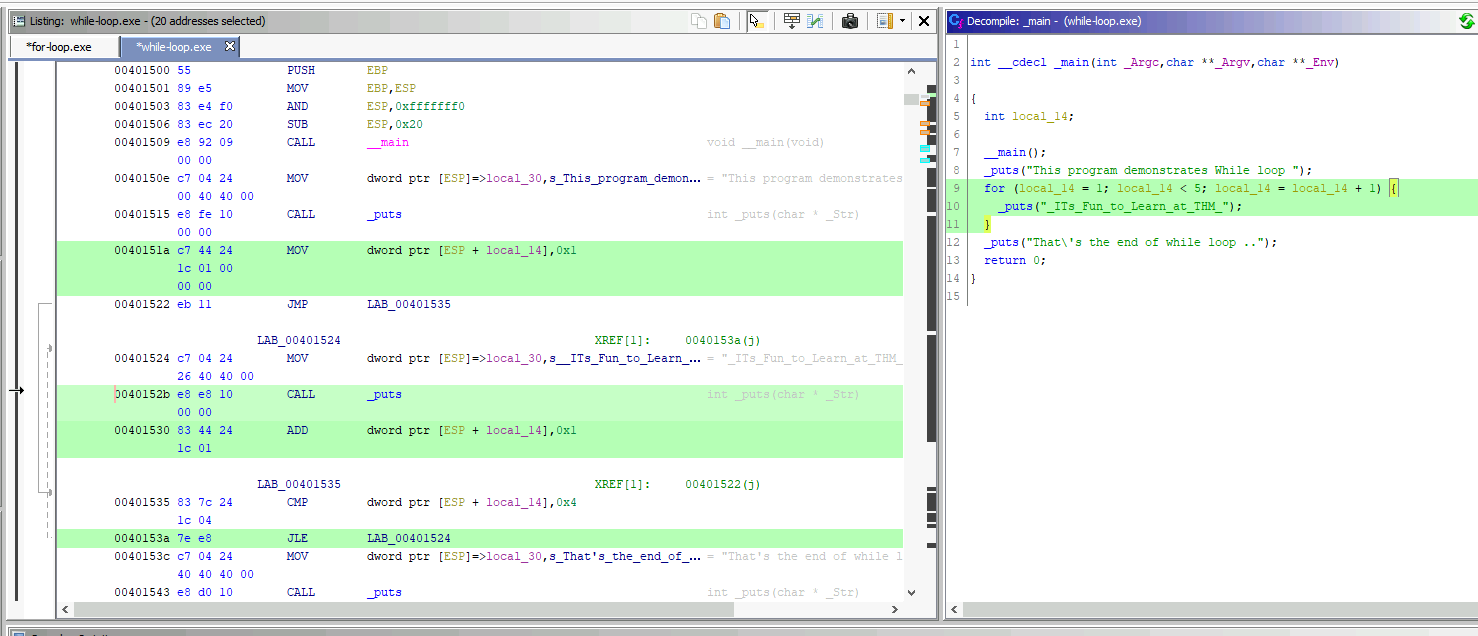
This is how it should look like:

Task: Examine the if-else.exe and while-loop.exe and answer the questions below.
Questions
What value gets printed by the while loop in the while-loop.exe program?
We can run the program or look at what data gets printf.
_puts("_ITs_Fun_to_Learn_at_THM_");
Answer: _ITs_Fun_to_Learn_at_THM_
How many times, the while loop will run until the condition is met?
From the decompiled code, this is what we get:
  for (local_14 = 1; local_14 < 5; local_14 = local_14 + 1) {
    _puts("_ITs_Fun_to_Learn_at_THM_");
  }
Answer: 4
Examine the while-loop.exe in Ghidra. What is the virtual address of the instruction, that CALLS to print out the sentence “That’s the end of while loop ..”?
For this question, we need to check where the call for the printf function is made:

Answer: 00401543
In the if-else.exe program, examine the strings and complete the sentence “This program demonstrates………..”
Here, we can use the String Search function of Ghidra:

Answer: This program demonstrates if-else statement
What is the virtual address of the CALL to the main function in the if-else.exe program?
This information is contained at the line of _main():

Answer: 00401509
Task 6 - An Overview of Windows API Calls
The Windows API is a collection of functions and services to enable developers to create Windows applications.
Create Process API
CreateProcessA is a function which creates a new process and its primary thread.
BOOL CreateProcessA(
  [in, optional]      LPCSTR                lpApplicationName,
  [in, out, optional] LPSTR                 lpCommandLine,
  [in, optional]      LPSECURITY_ATTRIBUTES lpProcessAttributes,
  [in, optional]      LPSECURITY_ATTRIBUTES lpThreadAttributes,
  [in]                BOOL                  bInheritHandles,
  [in]                DWORD                 dwCreationFlags,
  [in, optional]      LPVOID                lpEnvironment,
  [in, optional]      LPCSTR                lpCurrentDirectory,
  [in]                LPSTARTUPINFOA        lpStartupInfo,
  [out]               LPPROCESS_INFORMATION lpProcessInformation
);
This C code uses CreateProcessA to launch a new process:
#include <windows.h>
#include <stdio.h>

int main()
{
    // Declare a STARTUPINFO structure to specify window properties for the new process
    STARTUPINFO si;

    // Declare a PROCESS_INFORMATION structure to receive information about the new process
    PROCESS_INFORMATION pi;

    // Initialize the STARTUPINFO structure to zero to avoid any garbage values
    ZeroMemory(&si, sizeof(si));

    // Set the cb member of STARTUPINFO to its size, which is required by CreateProcess
    si.cb = sizeof(si);

    // Initialize the PROCESS_INFORMATION structure to zero to avoid any garbage values
    ZeroMemory(&pi, sizeof(pi));

    // Attempt to create a new process to run Notepad
    // Parameters:
    // - NULL: Application name is not specified separately
    // - "C:\\Windows\\notepad.exe": Command line to execute
    // - NULL, NULL: No special security attributes for the process or its primary thread
    // - FALSE: New process does not inherit handles from the calling process
    // - 0: No special creation flags
    // - NULL, NULL: No environment block or current directory specified
    // - &si: Pointer to the STARTUPINFO structure
    // - &pi: Pointer to the PROCESS_INFORMATION structure to receive process information
    if (!CreateProcess(NULL, "C:\\Windows\\notepad.exe", NULL, NULL, FALSE, 0, NULL, NULL, &si, &pi))
    {
        // If CreateProcess fails, print an error message with the error code from GetLastError
        printf("CreateProcess failed (%d).\n", GetLastError());
        return 1;
    }

    // Wait for the Notepad process to complete
    // Parameters:
    // - pi.hProcess: Handle to the process to wait for
    // - INFINITE: Wait indefinitely until the process terminates
    WaitForSingleObject(pi.hProcess, INFINITE);

    // Close the handle to the process as it's no longer needed
    CloseHandle(pi.hProcess);

    // Close the handle to the primary thread of the process as it's no longer needed
    CloseHandle(pi.hThread);

    // Return 0 to indicate successful execution of the program
    return 0;
}
When compiled into assembly, the CreateProcessA function call looks like this:
push 0
lea eax, [esp+10h+StartupInfo]
push eax
lea eax, [esp+14h+ProcessInformation]
push eax
push 0
push 0
push 0
push 0
push 0
push 0
push dword ptr [hWnd]
call CreateProcessA
This assembly code pushes the necessary parameters onto the stack in reverse order and then calls the CreateProcessA function. The CreateProcessA function then launches a new process and returns a handle to the process and its primary thread.
This is what the stack layout looks like after pushing every parameters.
+--------------------------+
| lpApplicationName        | <-- esp + 0x00 (NULL)
+--------------------------+
| lpStartupInfo            | <-- esp + 0x04 (address calculated by lea)
+--------------------------+
| lpProcessInformation     | <-- esp + 0x08 (address calculated by lea)
+--------------------------+
| lpCurrentDirectory       | <-- esp + 0x0C (NULL)
+--------------------------+
| lpEnvironment            | <-- esp + 0x10 (NULL)
+--------------------------+
| dwCreationFlags          | <-- esp + 0x14 (0)
+--------------------------+
| bInheritHandles          | <-- esp + 0x18 (FALSE)
+--------------------------+
| lpThreadAttributes       | <-- esp + 0x1C (NULL)
+--------------------------+
| lpProcessAttributes      | <-- esp + 0x20 (NULL)
+--------------------------+
| lpCommandLine            | <-- esp + 0x24 (value from hWnd)
+--------------------------+
During malware analysis, identifying the API call and examining the code can help understand the malware’s purpose.
Questions
When a process is created in suspended state, which hexadecimal value is assigned to the dwCreationFlags parameter?
To know that, we have to read the MSDN documentation available here.
Answer: 0x00000004
Task 7 - Common APIs used by malware
Most malware authors heavily rely on Windows API to accomplish their goals. That is why it is important to know how it is used in different malware variants.
Keylogger
This type of malware mostly use:
- SetWindowsHookEx: This function installs an application-defined hook procedure into a hook chain in order to monitor and intercept system events such as keystokes or mouse clicks.
- GetAsyncKeyState: This function retieves the status of a virtual key (ID used to represent keys of a keyboard) when the function is called, to determine if a key is being pressed or released.
- GetKeyboardState: This function retrieves the status of all virtual keys to determine the status of all keys on the keyboard.
- GetKeyNameText: This function retrieves the name of a key to determine the name of the pressed key.
Downloader
A downloader is a type of malware designed to download other malware onto a victim’s system.
- URLDownloadToFile: This function downloads a file from the internet and saves it to a local file. This can be used to fetch additional malicious code or update the malware.
- WinHttpOpen: This one itnitializes the WinHTTP API, which can be used to establish an HTTP connection to a rogue remote server.
- WinHttpConnect: It establishes a connection to a remote server.
- WinHttpOpenRequest: It enables the ability of doing HTTP requests like GET or POST. …
This is an example given by Microsoft to make HTTP requests with this API:
    BOOL  bResults = FALSE;
    HINTERNET hSession = NULL,
              hConnect = NULL,
              hRequest = NULL;

    // Use WinHttpOpen to obtain a session handle.
    hSession = WinHttpOpen(  L"A WinHTTP Example Program/1.0",
                             WINHTTP_ACCESS_TYPE_DEFAULT_PROXY,
                             WINHTTP_NO_PROXY_NAME,
                             WINHTTP_NO_PROXY_BYPASS, 0);

    // Specify an HTTP server.
    if (hSession)
        hConnect = WinHttpConnect( hSession, L"www.wingtiptoys.com",
                                   INTERNET_DEFAULT_HTTP_PORT, 0);

    // Create an HTTP Request handle.
    if (hConnect)
        hRequest = WinHttpOpenRequest( hConnect, L"PUT",
                                       L"/writetst.txt",
                                       NULL, WINHTTP_NO_REFERER,
                                       WINHTTP_DEFAULT_ACCEPT_TYPES,
                                       0);

    // Send a Request.
    if (hRequest)
        bResults = WinHttpSendRequest( hRequest,
                                       WINHTTP_NO_ADDITIONAL_HEADERS,
                                       0, WINHTTP_NO_REQUEST_DATA, 0,
                                       0, 0);

    // End the request.
    if (bResults)
        bResults = WinHttpReceiveResponse( hRequest, NULL);

    // Keep checking for data until there is nothing left.
    if (bResults)
        do
        {
            // Check for available data.
            dwSize = 0;
            if (!WinHttpQueryDataAvailable( hRequest, &dwSize))
                printf("Error %u in WinHttpQueryDataAvailable.\n", GetLastError());

            // Allocate space for the buffer.
            pszOutBuffer = new char[dwSize+1];
            if (!pszOutBuffer)
            {
                printf("Out of memory\n");
                dwSize=0;
            }
            else
            {
                // Read the Data.
                ZeroMemory(pszOutBuffer, dwSize+1);

                if (!WinHttpReadData( hRequest, (LPVOID)pszOutBuffer,
                                      dwSize, &dwDownloaded))
                    printf( "Error %u in WinHttpReadData.\n", GetLastError());
                else
                    printf( "%s\n", pszOutBuffer);

                // Free the memory allocated to the buffer.
                delete [] pszOutBuffer;
            }

        } while (dwSize > 0);

    // Report any errors.
    if (!bResults)
        printf( "Error %d has occurred.\n", GetLastError());

    // Close any open handles.
    if (hRequest) WinHttpCloseHandle(hRequest);
    if (hConnect) WinHttpCloseHandle(hConnect);
    if (hSession) WinHttpCloseHandle(hSession);
C2 Communication
Command and Control (C2) communication is a method malware uses to communicate with a remote server. This communication can be used to receive commands from the attacker, send stolen data and more.
- InternetOpen This function initializes a session for connection to the internet.
- InternetOpenUrl: This opens a URL for download, like for downloading malicious code or geting data from a C2 Server.
- HttpOpenRequest: This function opens HTTP request. Malware can use this function to send HTTP requests to a C2 server and receive commands or additional malicious code.
- HttpSendRequest: This function sends HTTP request to a C2 server. Malware can use this function to send data or receive commands from a C2 server.
Wininet is designed for desktop applications that require user interaction and features like caching and cookie management, while WinHTTP is optimized for server-side applications and automated tasks without user interaction. Besides these differences, both are suitable for communication using the HTTP protocol even if WinHTTP tends to have better performance. C2 Communication and Downloader can both use Wininet and WinHTTP, nevertheless these are shown here to present the usage of different API.
Data Exfiltration
Data exfiltration is the unauthorized data transfer from an organization to an external destination.
- InternetReadFile: This function reads data from an hRequest handle of
HttpSendRequest. Malware can use this function to steal data from a compromised system and transmit it to a C2 server. - FtpPutFile: This function uploads a file to an FTP Server.
- CreateFile: This function creates or opens a file or device to read or modify files containing sensitive information or system configuration data.
- WriteFile: This function writes data to a file or device.
- GetClipboardData: This API is used to retrieve data from the clipboard.
Dropper
A dropper is a malware designed to install other malware onto a victim’s system. Unlike a downloader, a dropper already contains the malicious payload.
- CreateProcess: This function creates a new process and its primary thread.
- VirtualAlloc: This function allocates a region of memory within the virtual address space of the calling process.
- WriteProcessMemory: This function writes data to an area of memory within the address space of a specified process.
API Hooking
API Hooking is a method malware uses to intercept calls to Windows APIs and modify their behavior. This allows malware to avoid detection by modifying legitimate programs and perform malicious actions.
- GetProcAddress This function retrieves the address of an exported function or variable from a specified DLL, in order to locate and hook API calls made by other processes.
- LoadLibrary: This loads a DLL into a process’s address space.
- SetWindowsHookEx: This API installs a hook procedure that monitors messages sent to a window or system event, to intercept calls to other Windows APIs and modify their behavior.
Anti-debugging and VM Detection
Theses techniques are used by malware to evade detection and analysis by security researchers.
- IsDebuggerPresent: This function checks whether a process is running under a debugger.
- CheckRemoteDebuggerPresent: This function checks whether a remote debugger is debugging a process.
- NtQueryInformationProcess: This one retrieves information about a specified process.
- GetTickCount: This function gets the number of milliseconds that have elapsed since the system was started.
- GetModuleHandle: This function retrieves a handle to a specified module like VM specific modules (VMWare tools…).
- GetSystemMetrics: This function retrieves various system metrics and configuration settings like CPU Revision or if the current session is a remote one.
Anti-debugging / AV detection are discussed in the Anti-Reverse Engineering room and more APIs used for these or other types of malware are discussed one https://malapi.io/.
Task 8 Process Hollowing: Overview
Process hollowing is a technique used by malware to inject malicious code into a legitimate process running on a victim’s computer. The process is as follow:
- Create a legitimate process like notepad and suspend it.
CreateProcessA()/NtSuspendProcess() - Allocate new memory of the size of the malicious code in the suspended process and write the code into it.
VirtualAllocEx()/WriteProcessMemory() - Modify the entry point of the process to point to the address of the malicious code.
GetThreadContext()/SetThreadContext() - Resume the rogued suspended process in order to execute the malicious code.
NtResumeProcess() - Clean up the process and any ressource used.
To get a better understanding of the technique, a sample C++ code is available below:
#include <windows.h>
#include <tlhelp32.h>
#include <iostream>

using namespace std;

/**
 * HollowProcess - Replaces the code of a target process with that of a source process.
 * @param szSourceProcessName: Path to the source executable.
 * @param szTargetProcessName: Name of the target process to be hollowed.
 * @return: True if the process hollowing was successful, false otherwise.
 */
bool HollowProcess(char *szSourceProcessName, char *szTargetProcessName)
{
    // Take a snapshot of all processes in the system
    HANDLE hSnapshot = CreateToolhelp32Snapshot(TH32CS_SNAPPROCESS, 0);
    PROCESSENTRY32 pe;
    pe.dwSize = sizeof(PROCESSENTRY32);

    // Iterate over the process list to find the target process
    if (Process32First(hSnapshot, &pe))
    {
        do
        {
            if (_stricmp((const char*)pe.szExeFile, szTargetProcessName) == 0)
            {
                // Open the target process with all access rights
                HANDLE hProcess = OpenProcess(PROCESS_ALL_ACCESS, FALSE, pe.th32ProcessID);
                if (hProcess == NULL)
                {
                    return false;
                }

                IMAGE_DOS_HEADER idh;
                IMAGE_NT_HEADERS inth;
                IMAGE_SECTION_HEADER ish;

                DWORD dwRead = 0;

                // Read the DOS header and NT headers of the target process
                ReadProcessMemory(hProcess, (LPVOID)pe.modBaseAddr, &idh, sizeof(idh), &dwRead);
                ReadProcessMemory(hProcess, (LPVOID)(pe.modBaseAddr + idh.e_lfanew), &inth, sizeof(inth), &dwRead);

                // Allocate memory in the target process for the source image
                LPVOID lpBaseAddress = VirtualAllocEx(hProcess, NULL, inth.OptionalHeader.SizeOfImage, MEM_COMMIT | MEM_RESERVE, PAGE_EXECUTE_READWRITE);
                if (lpBaseAddress == NULL)
                {
                    CloseHandle(hProcess);
                    return false;
                }

                // Write the headers of the source image to the target process
                if (!WriteProcessMemory(hProcess, lpBaseAddress, (LPVOID)pe.modBaseAddr, inth.OptionalHeader.SizeOfHeaders, &dwRead))
                {
                    CloseHandle(hProcess);
                    return false;
                }

                // Write each section of the source image to the target process
                for (int i = 0; i < inth.FileHeader.NumberOfSections; i++)
                {
                    ReadProcessMemory(hProcess, (LPVOID)(pe.modBaseAddr + idh.e_lfanew + sizeof(IMAGE_NT_HEADERS) + (i * sizeof(IMAGE_SECTION_HEADER))), &ish, sizeof(ish), &dwRead);
                    WriteProcessMemory(hProcess, (LPVOID)((DWORD)lpBaseAddress + ish.VirtualAddress), (LPVOID)((DWORD)pe.modBaseAddr + ish.PointerToRawData), ish.SizeOfRawData, &dwRead);
                }

                // Calculate the new entry point for the source image
                DWORD dwEntrypoint = (DWORD)pe.modBaseAddr + inth.OptionalHeader.AddressOfEntryPoint;
                DWORD dwOffset = (DWORD)lpBaseAddress - inth.OptionalHeader.ImageBase + dwEntrypoint;

                // Write the new entry point to the target process
                if (!WriteProcessMemory(hProcess, (LPVOID)(lpBaseAddress + dwEntrypoint - (DWORD)pe.modBaseAddr), &dwOffset, sizeof(DWORD), &dwRead))
                {
                    CloseHandle(hProcess);
                    return false;
                }

                // Close the handle to the target process
                CloseHandle(hProcess);

                break;
            }
        } while (Process32Next(hSnapshot, &pe));
    }

    // Close the handle to the snapshot
    CloseHandle(hSnapshot);

    // Initialize the STARTUPINFO and PROCESS_INFORMATION structures
    STARTUPINFO si;
    PROCESS_INFORMATION pi;
    ZeroMemory(&si, sizeof(si));
    ZeroMemory(&pi, sizeof(pi));

    // Create the source process in a suspended state
    if (!CreateProcess(NULL, szSourceProcessName, NULL, NULL, FALSE, CREATE_SUSPENDED, NULL, NULL, &si, &pi))
    {
        return false;
    }

    // Get the context of the source process's primary thread
    CONTEXT ctx;
    ctx.ContextFlags = CONTEXT_FULL;
    if (!GetThreadContext(pi.hThread, &ctx))
    {
        CloseHandle(pi.hThread);
        CloseHandle(pi.hProcess);
        return false;
    }

    // Update the entry point in the context to point to the new image
    ctx.Eax = (DWORD)pi.lpBaseOfImage + ((IMAGE_DOS_HEADER*)pi.lpBaseOfImage)->e_lfanew + ((IMAGE_NT_HEADERS*)(((BYTE*)pi.lpBaseOfImage) + ((IMAGE_DOS_HEADER*)pi.lpBaseOfImage)->e_lfanew))->OptionalHeader.AddressOfEntryPoint;
    if (!SetThreadContext(pi.hThread, &ctx))
    {
        CloseHandle(pi.hThread);
        CloseHandle(pi.hProcess);
        return false;
    }

    // Resume the source process's primary thread
    ResumeThread(pi.hThread);

    // Close handles to the source process and thread
    CloseHandle(pi.hThread);
    CloseHandle(pi.hProcess);

    return true;
}

int main()
{
    // Define the source and target process names
    char* szSourceProcessName = "C:\\\\Windows\\\\System32\\\\calc.exe";
    char* szTargetProcessName = "notepad.exe";

    // Attempt to hollow the target process and print the result
    if (HollowProcess(szSourceProcessName, szTargetProcessName))
    {
        cout << "Process hollowing successful" << endl;
    }
    else
    {
        cout << "Process hollowing failed" << endl;
    }

    return 0;
}
Questions
Which API is used to to write malicious code to the allocated memory during process hollowing?
Answer: WriteProcessMemory()
Task 9 - Analyzing Process Hollowing
Now that we understand the basics of Ghidra, some techniques in a disassembled version and some usages with the Windows API, we are going to analyze a sample called Benign.exe.
Our goals are:
- Examine API calls to find a suspiccious pattern
- Look at suspicious strings
- Find interesting functions
- Examine disassembled/decompiled code to find as much information as possible
Note: Even if we are starting by looking for Windows API calls right away, it is not how an analyst would start analyzing an unknown binary.
CreateProcess
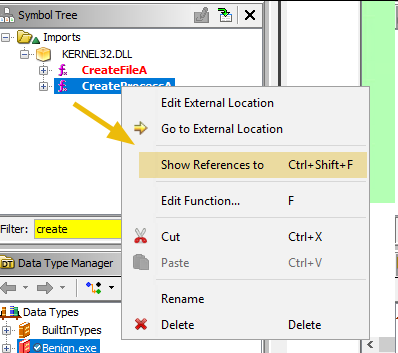
In the previous task, we have learnt in process hollowing that a legitimate victim process is created in the suspended state. We can search for CreateProcessA function in Imports -> Kernel32.dll and Show References to:
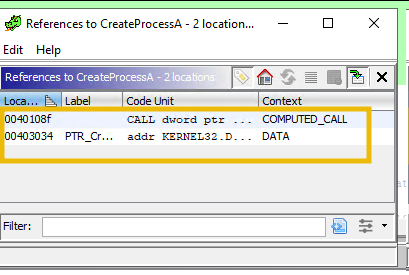
The first reference will take us to the Process Hollowing function, at the legitimate process creation:
PROCESS_INFORMATION pi;

    if (!CreateProcess(NULL, szSourceProcessName, NULL, NULL, FALSE, CREATE_SUSPENDED, NULL, NULL, &si, &pi))
    {
        return false;
    }

It clearly shows how the parameters on the stack are pushed in reverse order before calling the function? The 0x4 value represent the suspended state in the process creation flag.

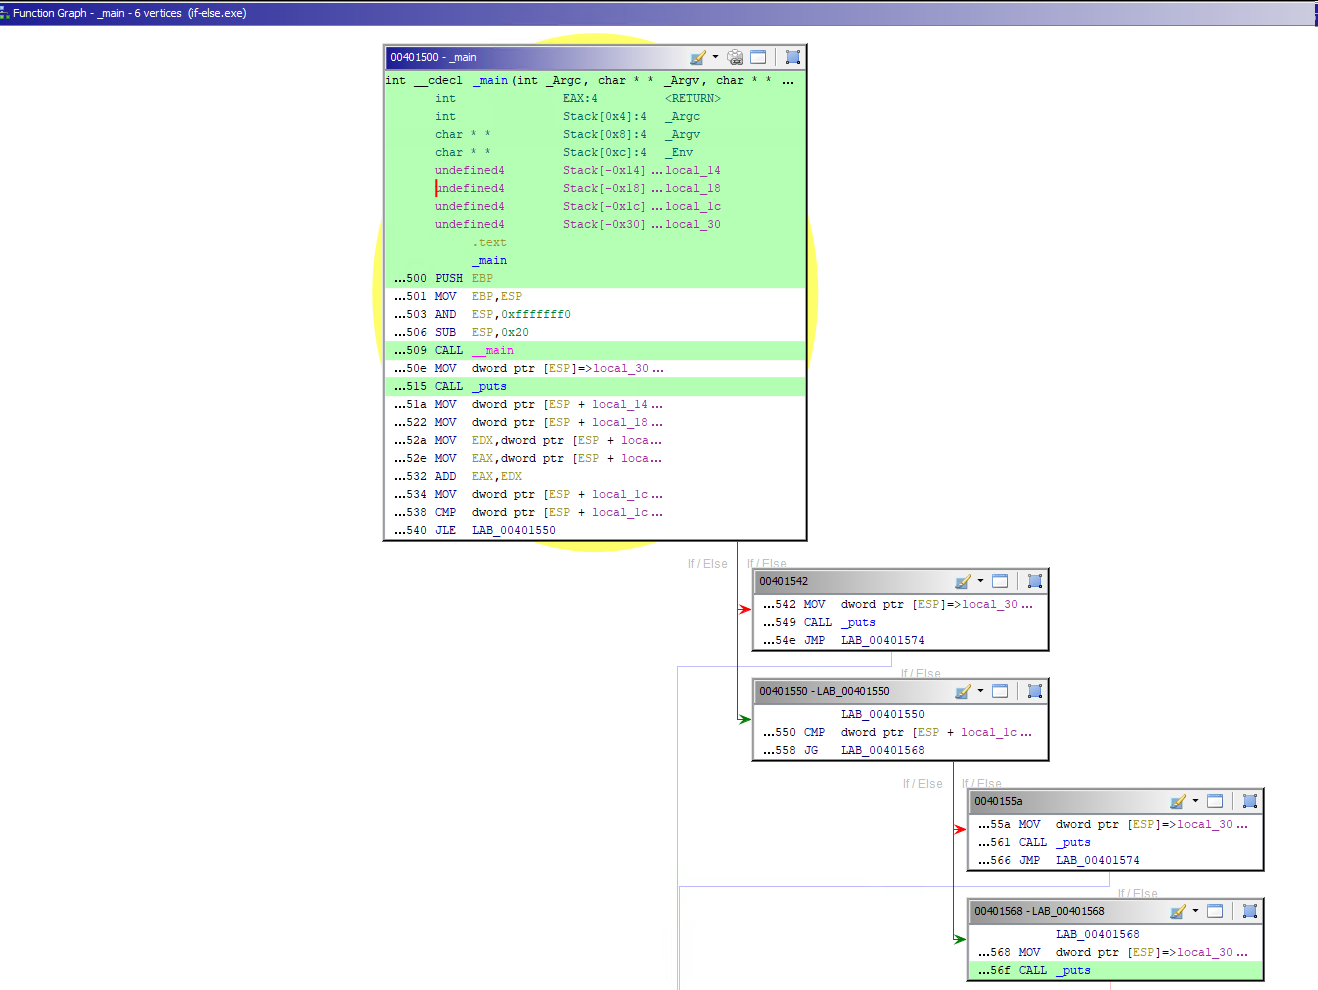
Graph View
The Display Function Graph in the toolbar will show the graph view of the disassembled code we are examining.

In this case, the program:
- Fails to create a victim process in the suspended state, it will follow the red arrow, thus the block 1.
- Successfully creates the victim rocess, it will follow the block 2, the green arrow.
Open Suspicious File
The CreateFileA funciton is either used to create or open an existing file. The behaviour is chosen by using GENERIC_READ or GENERIC_WRITE for the dwDesiredAccess parameter.

Then, new memory is created in the victim process using VirtualAlloc with the size of the file (GetFileSize).

Moreover, the hFile handle of CreateFileA will be used to get the content using the ReadFile function. Then, the file’s content will be written in the already allocated memory. The location of the new memory is the lpBuffer var.

Hollowing the process
Malware use ZwUnmapViewOfSection or NtUnmapViewOfSection API calls to unmap the target process’s memory.

NtUnmapViewOfSection takes exactly two arguments, the base address (virtual address) to be unmapped and the handle to the process that needs to be hollowed. Essentially, it removes a previously mapped section of memory, making that memory range available for other uses. In the context of process hollowing, malware uses NtUnmapViewOfSection to remove the existing memory contents of a target process. This creates a clean slate, allowing the attacker to inject and execute their own code within the address space of a legitimate process, thereby gaining control of it while minimizing detection risks.
Allocate Memory
Once the process is hollowed, malware must allocate needed memory using VirtualAllocEx before writing the rogue part.
Arguments passed to the function include a handle to the process, address to be allocated, size, allocation type, and memory protection flag.

Write down the memory
Once the memory is allocated, the malware will attempt to write the suspicious process into the memory of the hollowed process using WriteProcessMemory.

There were three calls to the WriteProcessMemory Function. The last call references to the code in the Kernel32 DLL; therefore, we can ignore that. From the decompiled code, it seems the program is copying different sections of the suspicious process one by one.
Resume Thread
Once all is sorted out, the malware will get hold of the thread using the SetThreadContext and then resume the thread using ResumeThread.

Questions
What is the MD5 hash of the benign.exe sample?
Go to the project browser, then right click on the executable -> properties
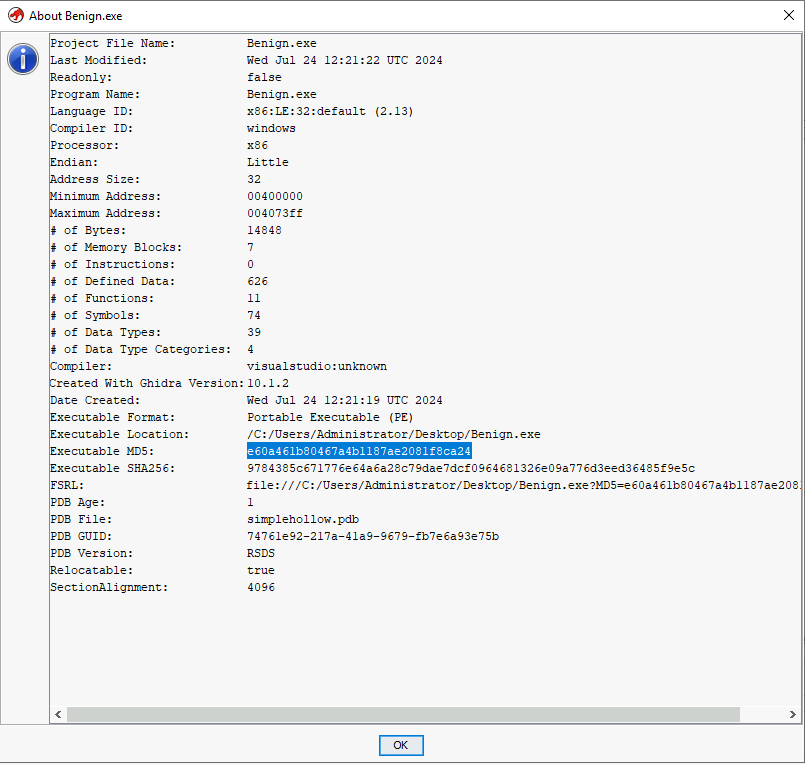
Answer: e60a461b80467a4b1187ae2081f8ca24
How many API calls are returned if we search for the term ‘Create’ in the Symbol Tree section?
For this question, we need to use the filter of the Symbol Tree.
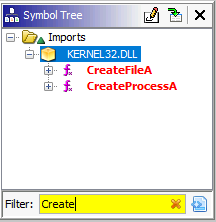
Answer: 2
What is the first virtual address where the CreateProcessA function is called?
We need to use the Show References to or Ctrl+Shift+F to search for occurences of the function in the program.
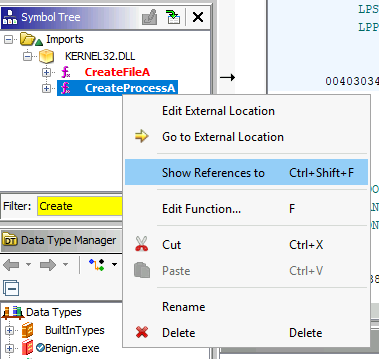

Answer: 0040108f
Which process is being created in suspended state by using the CreateProcessA API call?
The created process’s name is located at the second parameter of the CreateProcessA function.
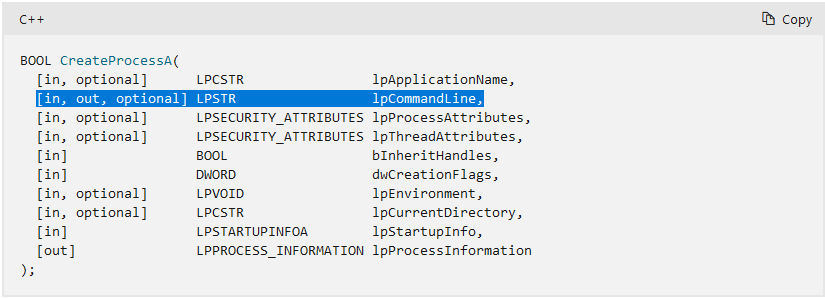

Answer: iexplore.exe
What is the first virtual address where the CreateFileA function is called?
The same thing to locate CreateProcessA is done here.

Answer: 004010f0
What is the suspicious process being injected into the victim process?
The process name can be found in the first parameter of CreateFileA.


Answer: evil.exe
Based on the Function Graph, what is the virtual address of the code block that will be executed if the program doesn’t find the suspicious process?
The executed code if the program doesn’t find the suspicious process would be this:

According to the Function Graph, this is the code clock we get:
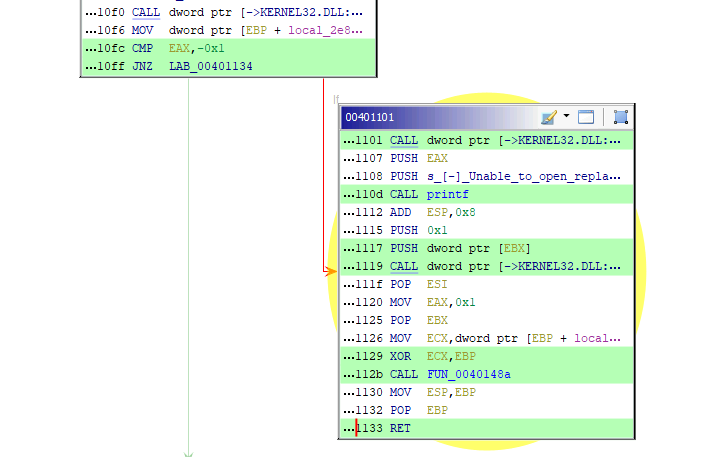
Answer: 00401101
Which API call is found in the import functions used to unmap the process’s memory?
The API call can be found in ntdll.dll:
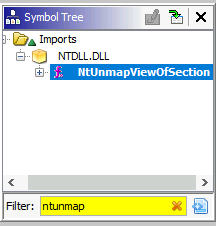
Answer: NtUnmapViewOfSection
How many calls to the WriteProcessMemory function are found in the code? (.text section)
There are two occurences/API calls shown in the Location References Provider.
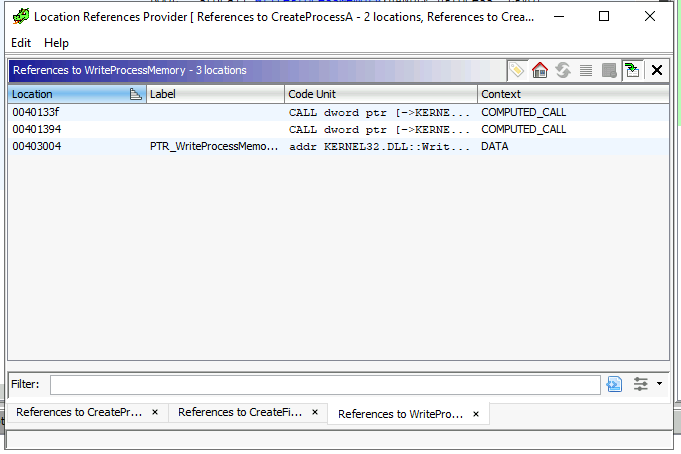
Answer: 2
What is the full path of the suspicious process shown in the strings?
To answer this, we have to go back to our CreateFileA function call.

Answer: "C:\\Users\\THM-Attacker\\Desktop\\Injectors\\evil.exe"
Task 10 - Conclusion
In summary, this room provided foundational knowledge in advanced static analysis of malware using Ghidra, a powerful and free tool for dissecting executable files. We explored common APIs employed by malware, such as CreateProcessA, CreateFileA, and WriteProcessMemory, and gained insights into the process hollowing technique, where a malicious code injects itself into a legitimate process. By mastering these elements, we enhance our ability to analyze and understand malware behaviors, ultimately improving our skills in cybersecurity and threat detection.
The next step after performing advanced static analysis is the dynamic analysis, which will be covered next.
Enjoy Reading This Article?
Here are some more articles you might like to read next: